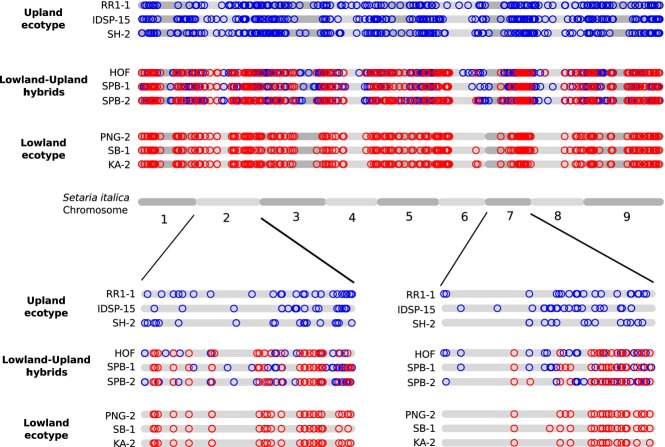
Figure 3.
Genome-wide distribution of ecotype-specific alleles in lowland–upland hybrids. Alleles private to either ecotype are mapped to the reference genome of Setaria italica. Patterns are shown in the three identified lowland–upland hybrid samples as well as three upland ecotype and three lowland ecotype samples. Red = lowland ecotype allele. Blue = upland ecotype allele. To normalize for the overall higher number of upland private alleles in the data set (due to the higher number of upland vs. lowland samples), a random subset of 25% of upland alleles is plotted. Genomic regions of predominantly upland or lowland ancestry can be identified. Magnifications of chromosomes 2 and 7 show chromosome-wide patterns at higher resolution.

