
Figure 5.
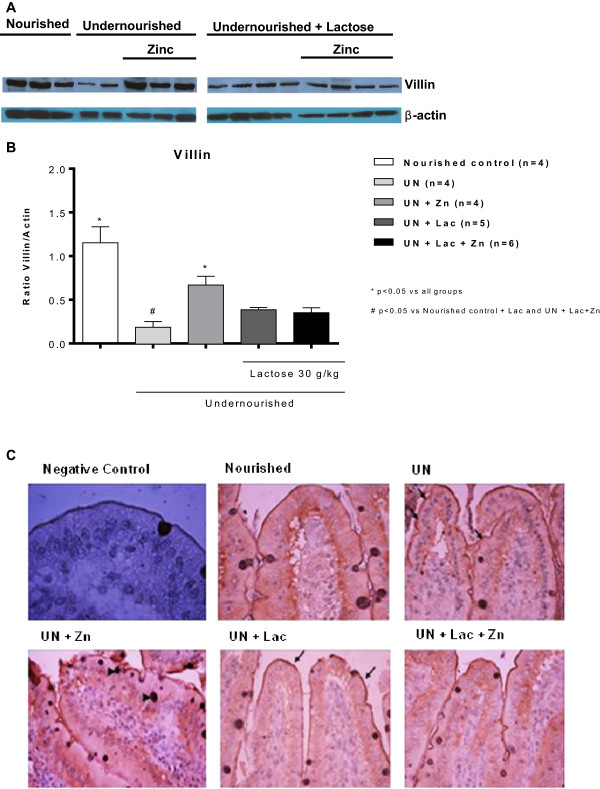
Villin jejunal expression. A. Representative villin immunoblots from snap-frozen jejunal tissue and B. villin:β-actin ratio band densitometry from experimental Wistar rats on the regional basic northeast diet (RBD) and following lactose administration. C. Representative jejunal villin immuhistochemistry from experimental Wistar rats. Note increase in microvilli thickness in the undernourished group (arrows). Arrow head: goblet cells. X400. The RBD was given ad libitum for 14 days and lactose (30 g/Kg, by gavage) was administered after the 8th day of the experiment. Values were analyzed by one-way ANOVA and T Student.