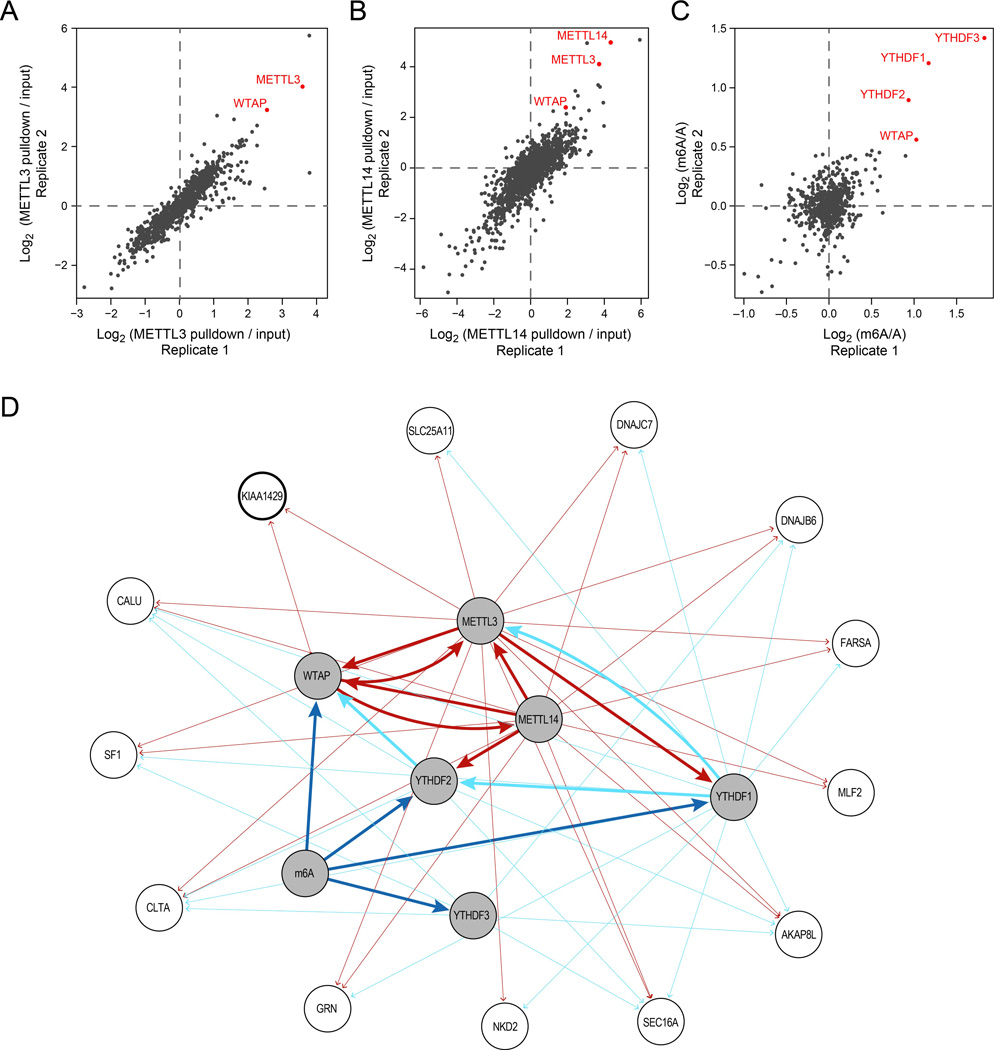
Figure 1. Proteomic identification of methyltransferase complex components.
(A-B) Proteins associated with HIS-tagged METTL3 (A) and V5-tagged METTL14 (B). Fold-changes quantifying enrichment versus control (Methods) across two biological replicates. (C) Proteins associated with biotinylated, methylated RNA baits, compared to biotinylated, non-methylated counterparts, in two biological replicates. (D) Network of associations with the bait proteins (shaded grey nodes) identified in the different mass-spec experiments. An edge from bait A to target B indicates that B was enriched (fold change > 1.5) when performing IPs on A. Only target nodes with an incoming degree ≥2 are displayed. Edge width distinguishes association between baits (thick lines) and with non-baits (thin lines). Edges are colored in dark red if they were enriched by a protein bait involving an m6a ‘writer’ (METTL3 / METTL14 / WTAP), cyan if they were enriched by a ‘reader’ (YTHDF1 / YTHDF2 / YTHDF3), or dark blue if they were enriched with a methylated bait. The node for KIAA1429, further analyzed functionally, is marked by a thicker border.

