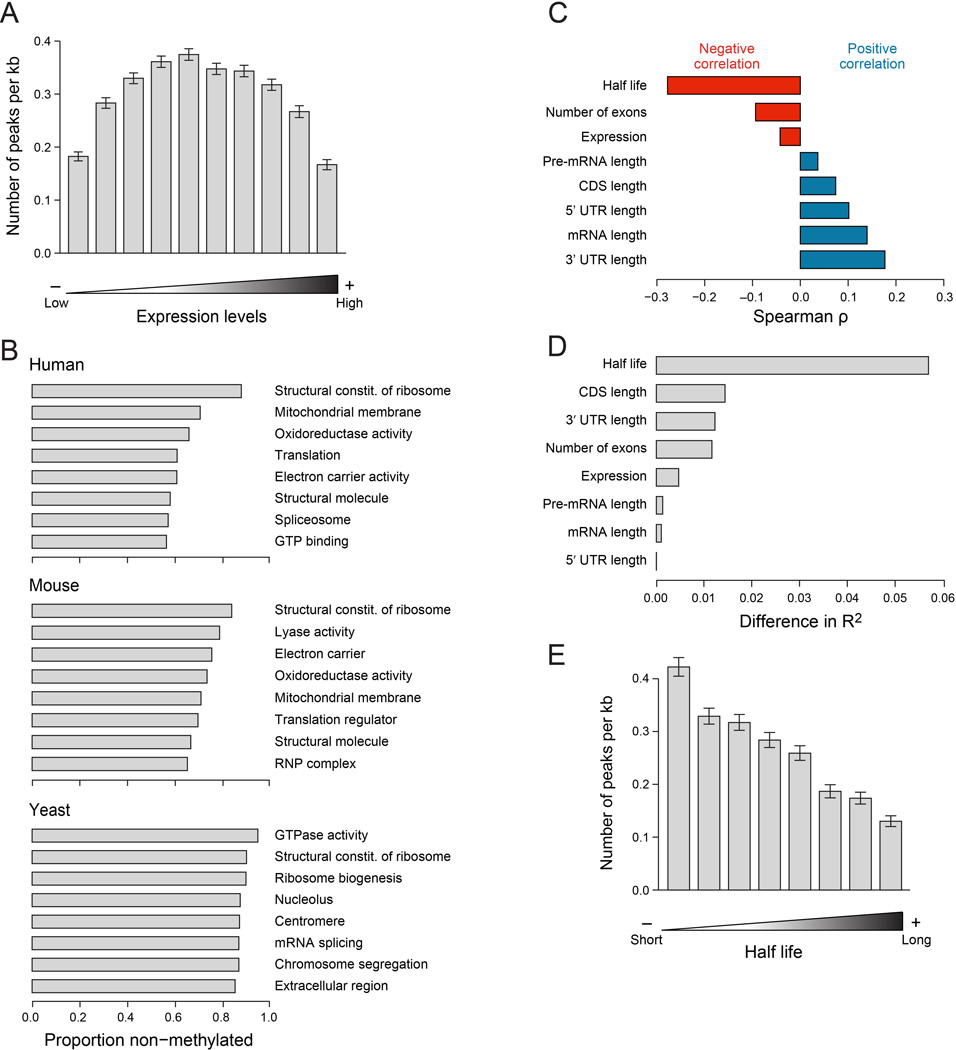
Figure 4. Methylations are depleted from housekeeping genes, and associated with decreased transcript stability.
(A) Association between gene expression and methylation density in MEFs. (B) Top GO categories harboring non-methylated genes in human (top), mouse (middle), and yeast (yeast). Shown is the proportion of non-methylated genes in each category. Only genes expressed >60th percentile and longer than 500nt and only GO categories harboring >30 matches genes were considered for this analysis. (C) Correlations (Spearman ρ, X axis) between different gene attributes (Y axis) and methylation density. Transcript half-lives were obtained from (Schwanhausser et al., 2011). We used only sites defined in A549 cells (Fig. 2E), in protein coding genes longer than 500nt and expressed above the 60th quantile, with a maximum POI score >8, with at least 50% increased POI score in non-perturbed cells compared to WTAP-depleted cells, and which were in segments other than the TSS segment. (D) Analysis examining the difference in variability explained (R2, X axis) upon elimination of each of the indicated variables from a linear regression model predicting methylation density on the basis of all of them. (E) Association between mRNA half lives (Schwanhausser et al., 2011) and methylation densities. Half lives were binned into 10 equally sized bins, and mean methylation densities for each bin were calculated. Error bars - SEM.

