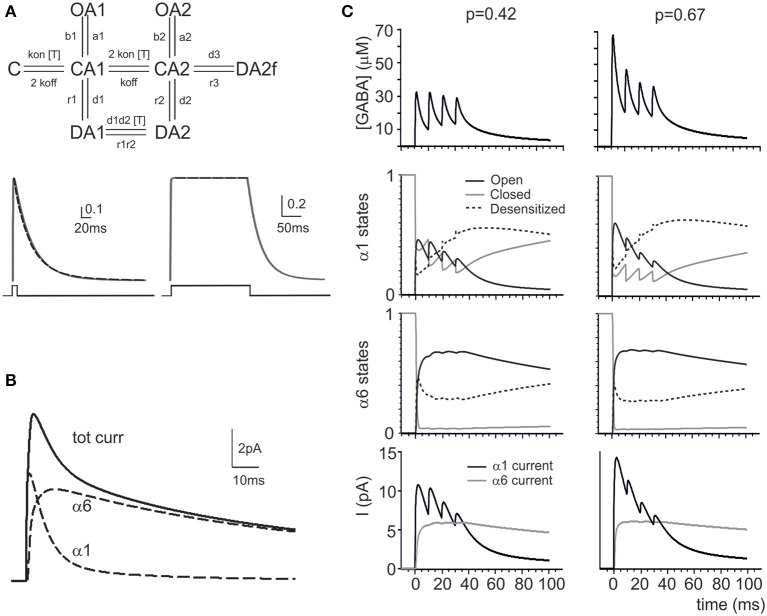
Figure 2.
Modeling GABA receptor-mediated responses in the cerebellar glomerulus. (A) Schematic representation of the kinetic scheme for α1 and α6 subunit-containing receptors (modified from Pugh and Raman, 2005). The traces (continuous lines) show responses to brief and long 1 mM GABA pulses (taken from Tia et al., 1996). The simultaneous fitting of the decay phase of the α6 response to a fast (1 ms) GABA neurotransmitter pulse (1 mM) and of the almost constant response to a long (200 ms) GABA neurotransmitter pulse (1 mM) is shown (dashed lines) (see Methods and Table 3 for details). (B) The simulated eIPSC generated by the model at 0 mV in response to a 1 ms GABA pulse shows amplitude and kinetics reproducing experimental eIPSCs. The contribution of the α1 and α6 components in the eIPSC is shown, revealing that the α1 receptors account for the direct response while the α6 receptors account for the indirect response (dashed lines). (C) The simulations show the impact of changing pI (from 0.42 to 0.64) on the GABAergic response to a train of impulses at 100 Hz. The pI increase changes the profile of GABA concentration (in particular, the first peak of GABA concentration is enhanced) modifying the kinetic states of α1 and α6 responses (O, C, and D indicate the sum of all the open, closed and desensitized states for each receptor type). The α1 is more affected than α6 response by pI, since α6 receptors reacts slowly and tends to saturate. The associated changes in the α1 and α6 currents are shown at the bottom.

