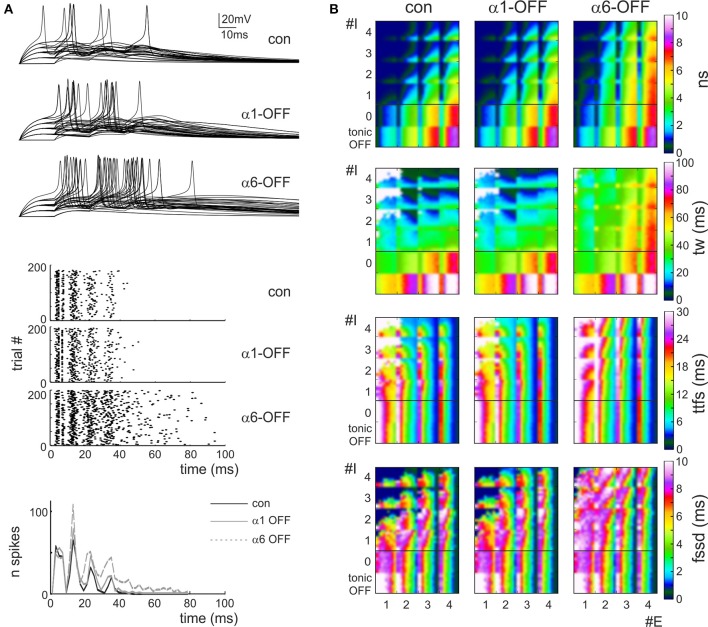
Figure 4.
Effect of the phasic and tonic inhibition on granule cell firing in response to mossy fiber bursts. (A) Exemplar voltage traces simulated using MF = 2, Pe = 0.3, GoC = 2, Pi = 0.2 [cf. coordinates (2.3, 2.2) in the E/I space in B]. The traces show responses in control and after switch-off of α1 and α6 subunit containing receptors. (B) E/I response space for number of spikes (sn), time window (tw), time to first spike (ttfs), first spike standard deviation (fssd) in control (con) and after switch-off α1 and α6 subunit containing receptors (α1-OFF and α6-OFF) and of the GABA tonic current (tonic OFF). The E/I space is generated by reporting the number of active excitatory (1 < E < 4) and inhibitory (0 < I < 4) synapses on the two axes and by using colors to represent the parameter values. For each E/I combination, a subquadrant identifies a pE/pI subspace (0 < pE < 1 on the x-axis, 0 < pI < 1 on the y-axis). Note that α6 subunit-containing receptors are most effective in modifying the parameters.

