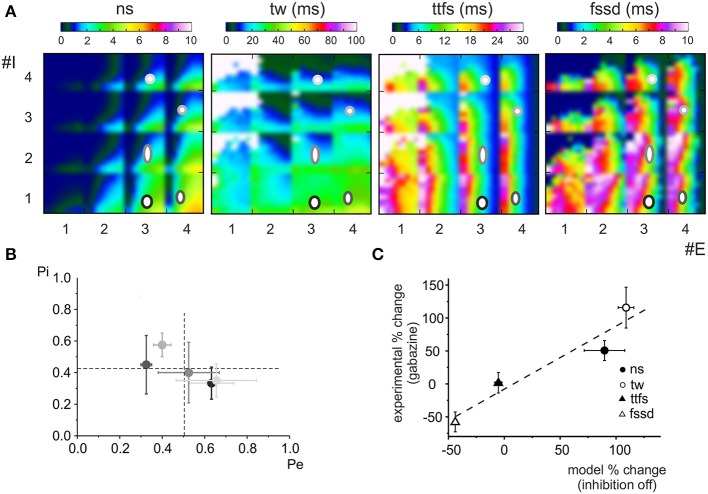
Figure 6.
Model predictions of experimental GABA-A receptor blockage. (A) The experimental parameters reported in Figures 1C,E are reported on the control E/I response space for the 5 cells showing E < 4 and I < 4 yielding the corresponding Pe and Pi values. The position of symbols and their size correspond to the mean ± MSE of data values extrapolated from number of spikes (ns), time window (tw), time to first spike (ttfs) and first spike standard deviation (fssd) (same gray scale as in B). (B) The Pi and Pe values obtained in A and averaged across the different parameters (sn, tw, ttfs, and fssd) are reported as mean ± MSE for each of the 5 cells considered in (A). The release probabilities felt in a narrow range around the average values of Pe = 0.51 ± 0.06 and Pi = 0.42 ± 0.04 (dashed lines). (C) The plot compares the relative change of number of spikes (ns), time window (tw), time to first spike (ttfs) and first spike standard deviation (fssd) after gabazine perfusion in the 5 recordings shown in (A,B) (mean ± MSE) with that caused by switching off phasic and tonic inhibition in the model. The data points were fitted with a linear function yielding a slope of 0.95 (R2 = 0.914, n = 4).

