Figure 8.
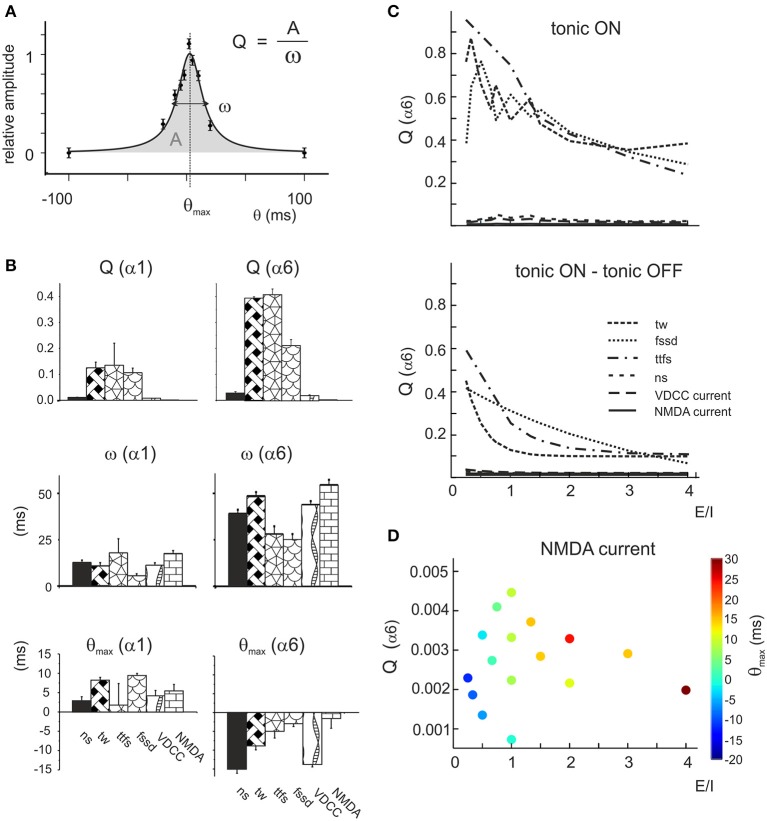
Resonance of the parameter distributions at different E/I levels. (A) Exemplar fitting with a Lorentzian function (Equation 4) applied to the phase-lag plot (cf. Figure 7B) indicating the geometrical meaning of the parameters Q, A, ω, θmax. (B) The average values of Lorentzian parameters during α1 or α6 switch-off are reported for number of spikes (ns), time window (tw), time to first spike (ttfs), first spike standard deviation (fssd), VDCC current and NMDA current. Note that Q(α6) and ω(α6) is always larger than Q(α1) and ω(α1), while θmax(α6) is negative and θmax(α1) is positive. These data are averaged over the whole parameter response space. (C) The top panel shows the Q factors of the α6OFF difference phase-lag curves (α6OFF-CTRL). Note that Q of time window (tw), time to first spike (ttfs) and first spike standard deviation (fssd) decrease with increasing E/I, while the other parameters are much less affected. The bottom panel shows the difference Q factors obtained as Q (tonic OFF)–Q (tonic ON). Note that the trends of these Q plots is qualitatively similar to that reported above. (D) Precession of θmax(α6) for the NMDA Q factor. The phase of the peak (color coded) increases with increasing E/I.

