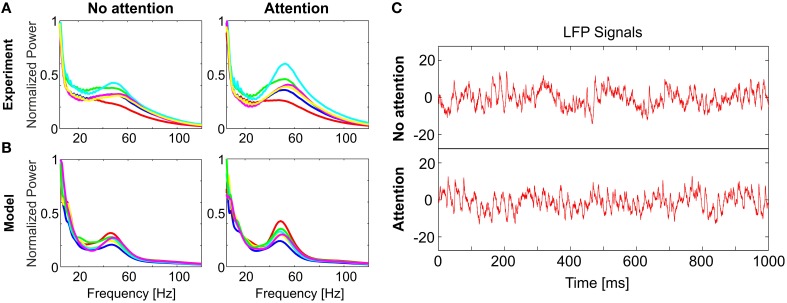
Figure 2.
Comparison of model dynamics to experimental recordings. LFP spectral power distributions in (A) the experiment and (B) the model for non-attended (left) and attended (right) conditions. In each case, spectra averaged over trials is shown for 6 stimuli (different colors). In both (A,B) the spectra for each stimulus is normalized to its respective maximum in the non-attended case. Model spectra reproduce the stereotypical 1/f background as well as the γ-peaks observed in the experimental spectra. Under attention, γ-band oscillations become more prominent and spectra for different stimuli become visibly more discriminable. (C) Single trial LFP time-series from the model, illustrating the analyzed signals in the non-attended (top) and attended (bottom) conditions. [Data shown in (A) is courtesy of Dr. Andreas Kreiter and Dr. Sunita Mandon and Katja Taylor (Taylor et al., 2005)].

