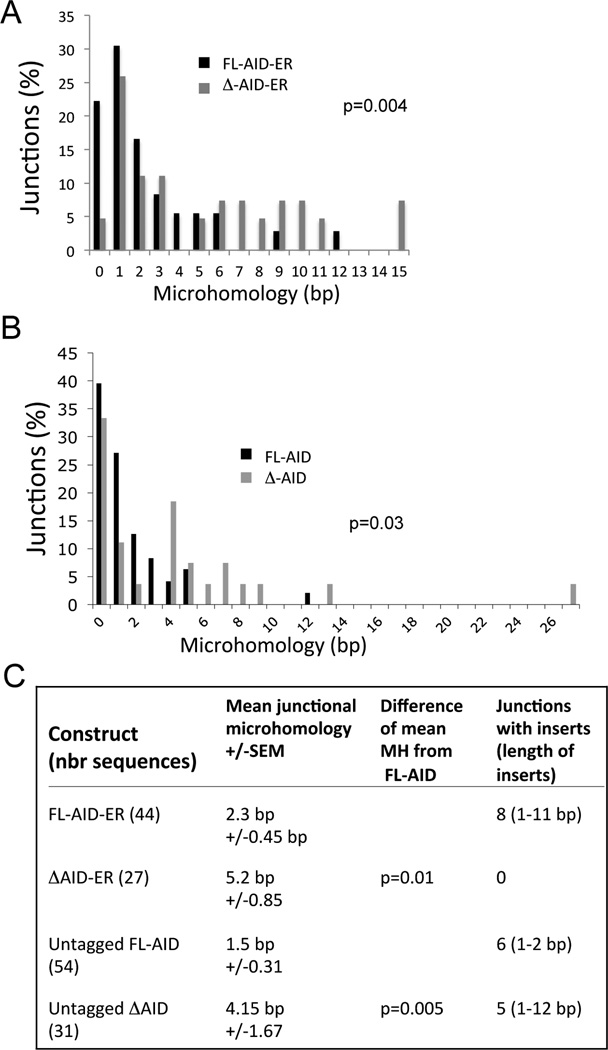
Figure 6. Microhomology (MH) at Sµ-Sα junctions in aid−/− cells transduced with AID-ER, ΔAID-ER, and untagged AID and ΔAID.
(A) Graph indicates the percent of junctions with the indicated lengths of microhomology cloned from aid−/− cells transduced with AID-ER and ΔAID-ER retroviruses. Junctions with inserts are not included. (B) Same as A except junctions from cells transduced with untagged AID and ΔAID. The indicated p values show differences in distributions of MH between AID and ΔAID, determined by a Mann-Whitney 2-tailed test. (C) Compiled mean junctional MH +/− SEM for the ER tagged and untagged AID and ΔAID, as indicated. Sequences with inserts are not included in the calculations of MH.

