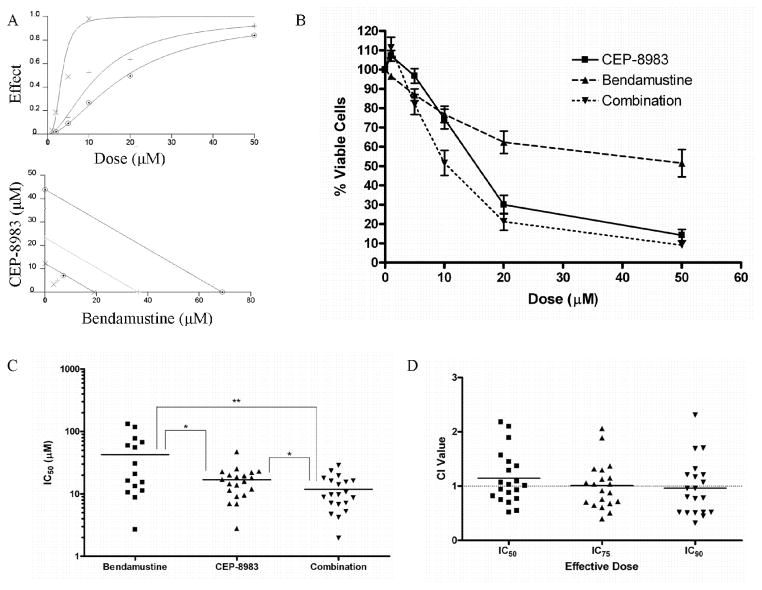
Figure 2. Cytotoxicity analysis of CLL primary patient samples.
(A) Dose-effect curve (⊙=bendamustine, +=CEP-8983, ×=combination at 1:1 ratio). Bottom graph: Isobologram of combination (lower line=90% inhibitory concentration (IC90), middle line=IC75, upper line=IC50). The markings ×, +, and ⊙, represent a measure of the drug interactions at the IC50, IC75, and IC90, respectively. (B) Composite dose curve depicting % viable cells (relative to untreated) after treatment with CEP-8983, bendamustine, and combination at a 1:1 ratio. (C) Plot depicting the IC50 values of CLL primary patient samples treated with CEP-8983, bendamustine, and combination. Mean IC50 values were 16.84, 42.53, and 11.85 μM for CEP-8983, bendamustine, and the combination, respectively (*p<0.05, **p<0.01). (D) Plot depicting the combinational index (CI) of CLL samples at the IC50, IC75, and IC90. Values below 1 are synergistic. Mean CI values are 1.146, 1.010, and 0.9650 at the IC50, IC75, and IC90, respectively.

