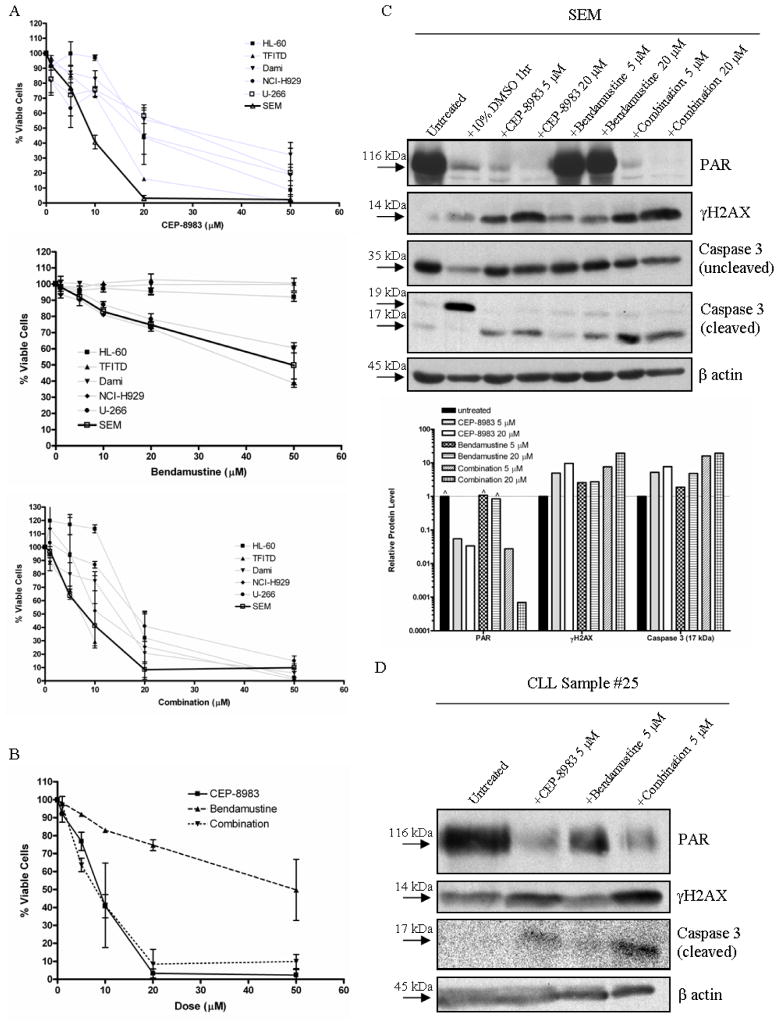
Figure 3. Responses of cell lines and CLL samples to CEP-8983, bendamustine and combination of both drugs.
(A) The acute myeloid leukemia (AML) cell lines with p53 mutations HL-60, TFITD, and Dami, the multiple myeloma cell lines U-266(p53 mut) and NCI-H929(p53 WT), and the B cell precursor leukemia cell line SEM(p53 WT) were treated with increasing doses (0–50 μM) of CEP-8983 (top graph), bendamustine (middle graph), and a 1:1 combination of the two drugs (bottom graph) for 72 hours. The cytotoxicity/% viability (relative to untreated) was analyzed using the MTT assay. SEMs were the most sensitive to CEP-8983 and the combination. The dose curves for the three B cell cancer cell lines treated with bendamustine are similar and significantly different from the three AML cell lines (p<0.05). (B) Composite of SEM dose curves. (C) Western blot analysis of SEM cells treated with CEP-8983, bendamustine, and the combination, all at two different dose levels (5 and 20 μM) for 72 hours. The 10% DMSO treatment represents a positive control for apoptosis. The graph below the blots is a log scale representation of the relative protein levels, determined by their optical density in the blot, and normalized to β actin levels. Quantification allows the categorization of synergistic interactions, including synergistic induction of DSBs, as shown by γH2AX levels, and synergistic induction of apoptosis, as shown by cleaved caspase 3 levels (^ indicates saturation of densitometer). (D) Western blot analysis of a chronic lymphocytic leukemia (CLL) primary patient sample treated with CEP-8983, bendamustine, and the combination, all at 5 μM for 72 hours. The results mimic those seen in SEM.

