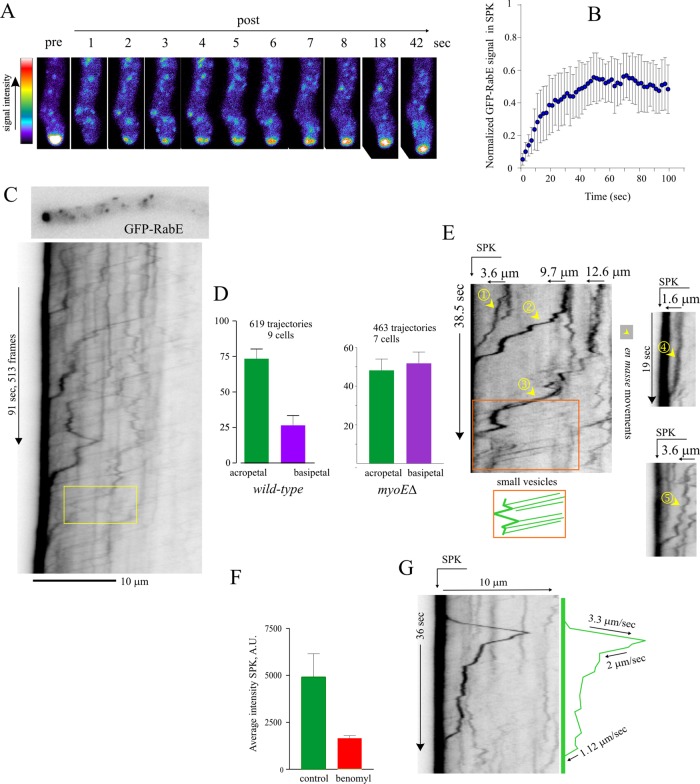
FIGURE 5:
Intense bombardment of the apical region by exocytic RabERAB11 traffic. (A) Still-frame micrographs showing fast FRAP recovery of the SPK GFP-RabE signal. (B) Normalized GFP-RabE signal in the SPK after bleach event. Error bars are SD of n = 6 cells. (C) Kymograph traced across the axis of the depicted hyphal tip. Yellow box indicates an acropetally moving carrier that reverses direction. Derived from Supplemental Movie S1. (D) Percentage of acropetal and basipetal GFP-RabE trajectories in wild-type and myoE∆ cells. Error bars are SD. (E) Kymograph plots depicting five examples of large GFP-RabE carriers moving to the SPK and an area (boxed) depicting intense traffic of small carriers with uniform speeds. (F) Average intensity of the GFP-RabE SPK measured in sum projections of Z-stacks of images from cells treated or not with 10 μg/ml benomyl. (G) Kymograph depicting basipetal movement of a large GFP-RabE carrier. Experiments were carried out with strain MAD4120 and its myoE∆ derivative, MAD4409.

