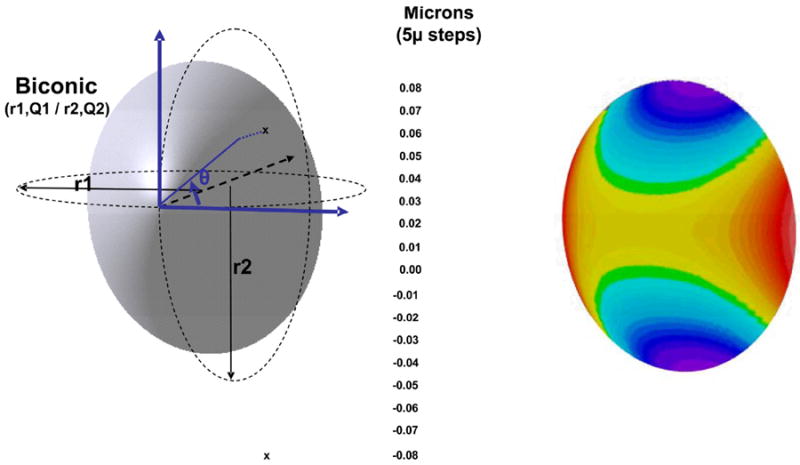
Figure 2.

Representation of the elevation map of a corneal surface modeled as a biconic. The flatter and steeper meridians have apical radii of r1 and r2 (r1>r2) and asphericity of Q1 and Q2, respectively. The color scale has a 5 micron steps. This scale is used for the Figures R5 and R6.
