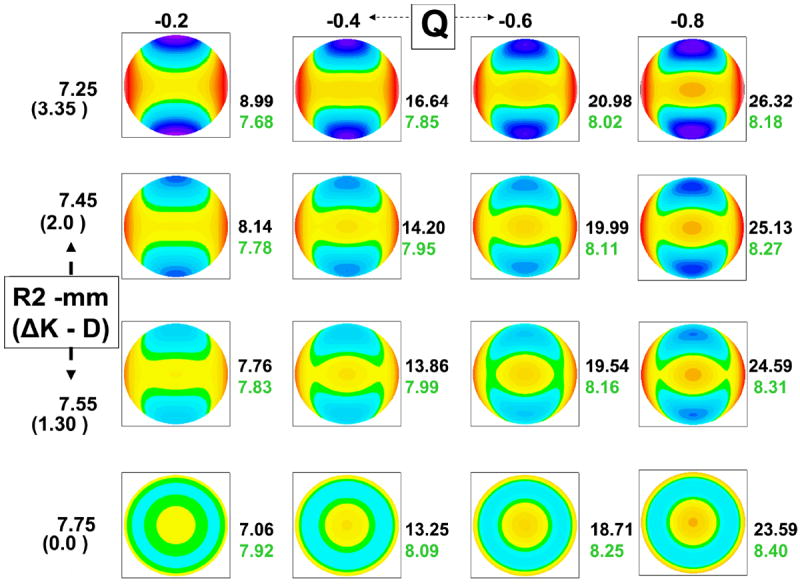
Figure 6.

Elevation plots of corneal surface of increasing negative asphericty (X axis) and apical toricity (Y axis). r2 is the apical radius of the vertical meridian and is expressed in mm (the corresponding dioptric power change from the horizontal meridian is shown in parenthesis) along the Y axis. The top row represents corneas with high astigmatism of 3.35 Diopters (r2=7.25 mm). The plots in rows 2-4 represent surface plots of corneas with less astigmatism (2D, 1.3D, and 0 D). The value of the distance of the apex to the sphere (microns, black font) and the radius of the BFS (mm, green font) are shown to the right of each surface plot.
