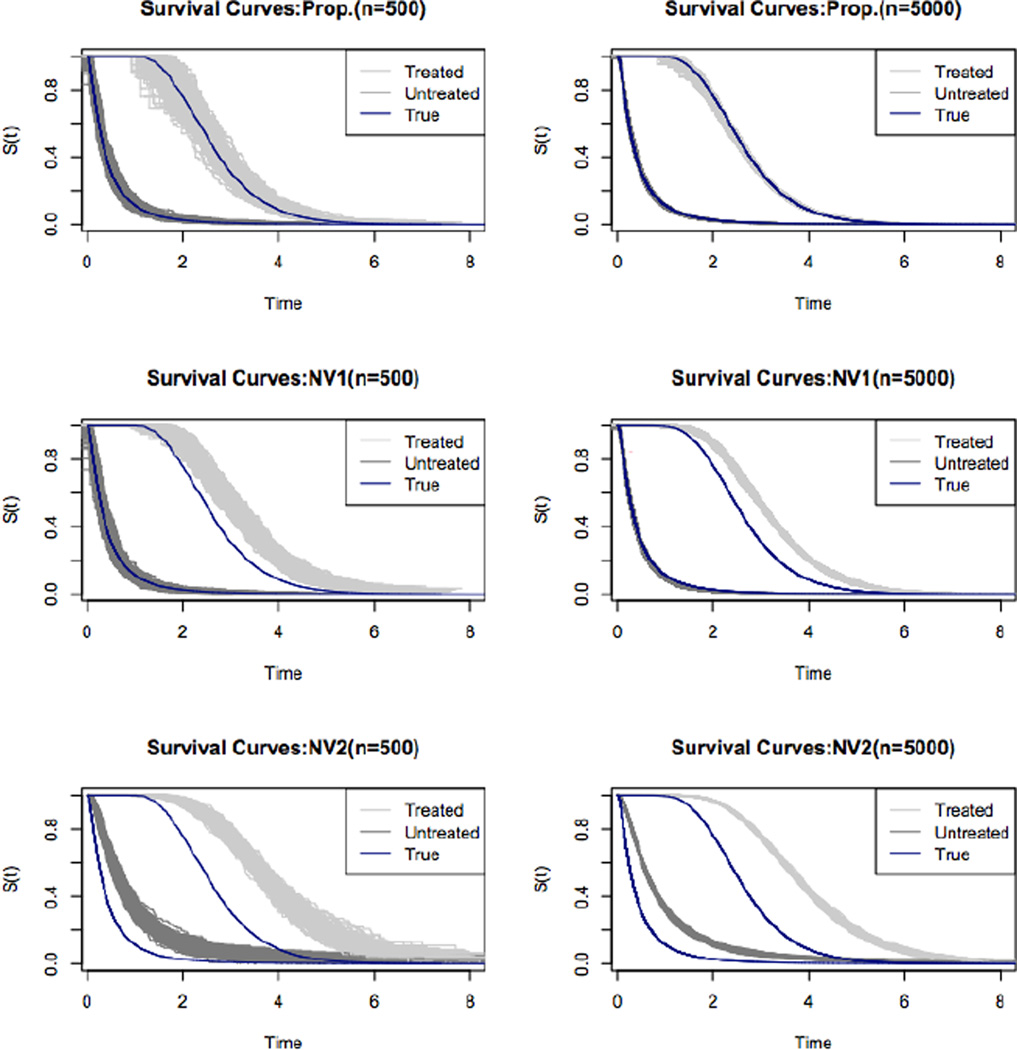
Figure 1.
Simulation: The estimated survival curves using the proposed (Prop.) and two naive estimators. The light and dark shaded areas are the treated and untreated survival curves, respectively. The solid line represents the true curve. NV1 is when the propensity score is naively estimated without considering the length-biased sampling. NV2 is when we ignore both the confounding and the length-biased sampling.

