Figure 4.

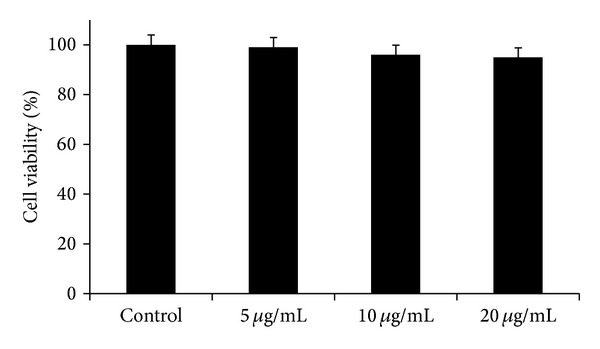
Cell viability in rat astrocytes after treatment with different concentrations B. aetnensis C. Presl. Each value represents the mean ± SD of 5 separate experiments.

Cell viability in rat astrocytes after treatment with different concentrations B. aetnensis C. Presl. Each value represents the mean ± SD of 5 separate experiments.