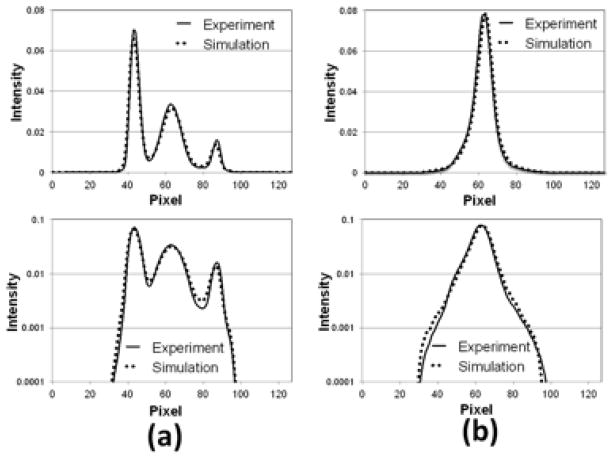
Figure 4.
Horizontal profiles of the simulated and experimentally acquired projections shown in Figure 3. a), profiles of the first projection from the left; b), profiles of the fourth projection from the left. The profiles are plotted in both linear scale (top) and logarithmic scale (bottom).

