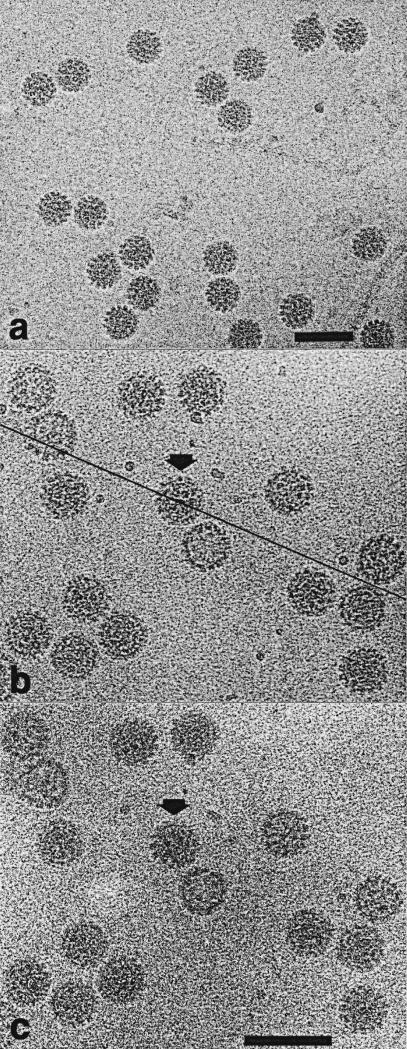
Figure 2.
Electron micrographs of vitrified CRPV samples. CRPV particles are distributed in a monodisperse layer indicating that the frozen-hydrated sample is about as thick as the diameter of the particles. Capsomeres appear as “knob-like” structures, which are prominent especially along particle edges. a, CRPV dialyzed against 10 mM Tris-HCl and 1 mM EDTA (pH 8.0). These particle images were used to compute the 3D reconstruction seen in Figure 3. Bar represents 100 nm. b and c, Tilting experiment with CRPV dialyzed against 20 mM Tris-HCl, 1 M NaCl (pH 7.4). View of particles with specimen stage at 0° (b) and –5° (c) tilt. The tilt axis (line in b) is approximately 23° from the horizontal. The particle highlighted with the arrows also appears in Figure 4. Bar represents 100 nm.

