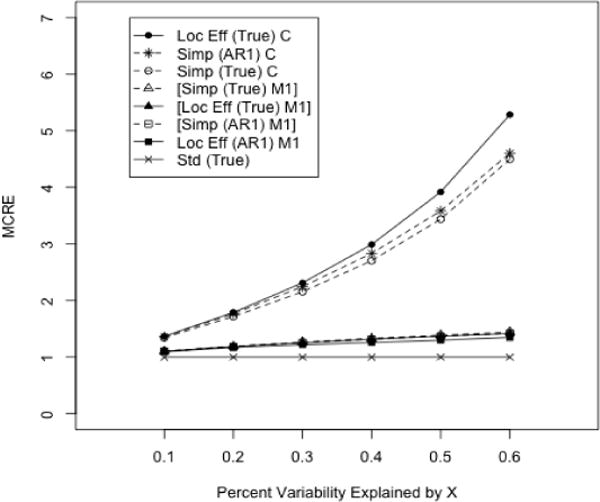
Figure 2.

MCRE of Locally Efficient and Simple Augmented GEE Relative to Standard (Unaugmented) GEE. Continuous longitudinal outcomes. Estimators corresponding to each curve are denoted by ‘Estimator (Marginal Working Covariance) Outcome Regression’ using the abbreviations: Loc Eff-Locally Efficient, Simp-Simple Augmented, Std-Standard; AR1-Autoregressive(1) V(Y|A), True-Exchangeable/AR1 for V{E(Y|X,A)} and V(Y|X,A), respectively; C-Correct, M1-Model 1;α=0.3. The order of curves in the legend follows the order of curves on the figure, with the set of superimposed curves denoted by ‘[]’.
