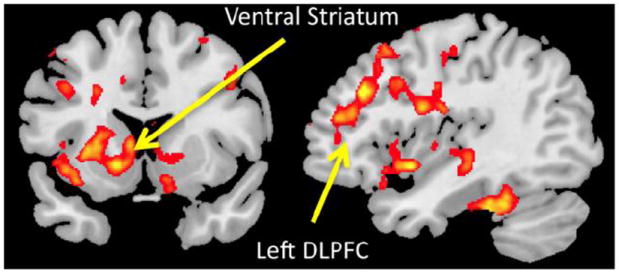
Figure 4.

Whole brain correlation of neuroticism with the Utility Surplus Long vs. Utility Surplus Short contrast. Peak voxel of the ventral striatum: t = 3.36, MNI coordinates: (-14, 10, -6). Peak voxel of the left DLPFC/middle frontal gyrus cluster: t = 4.08, MNI coordinates: (-37, 29, 30) (clusterwise pFDR < .05).
