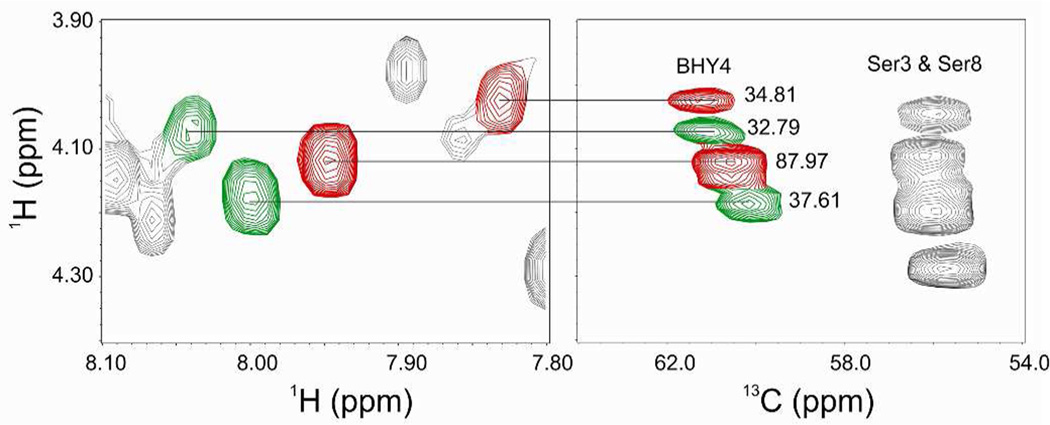
Figure 3.
TOCSY (left panel) and HSQC (right panel) spectra of BHY4 in the wild-type sample. The proportions of Asn1 and BHN1 variants were determined by the measurement of the Ha-Ca cross peak intensities of BHY4 in the HSQC spectra. These values are listed next to their corresponding peaks in the right panel. The peaks in red and green represent the BHY4 peaks associated with BHN1 and Asn1 variants, respectively. Based on the calculation of their relative proportions, i.e. (34.81 + 87.97 for the BHY4 peaks found in the BHN1 conformational variants) and (32.79 + 37.61 for the BHY4 peaks found in the Asn1 conformational variants), the approximate proportion of the Asn1 variants could be calculated as (32.79 + 37.61)/(34.81 + 87.97) + (32.79 + 37.61).

