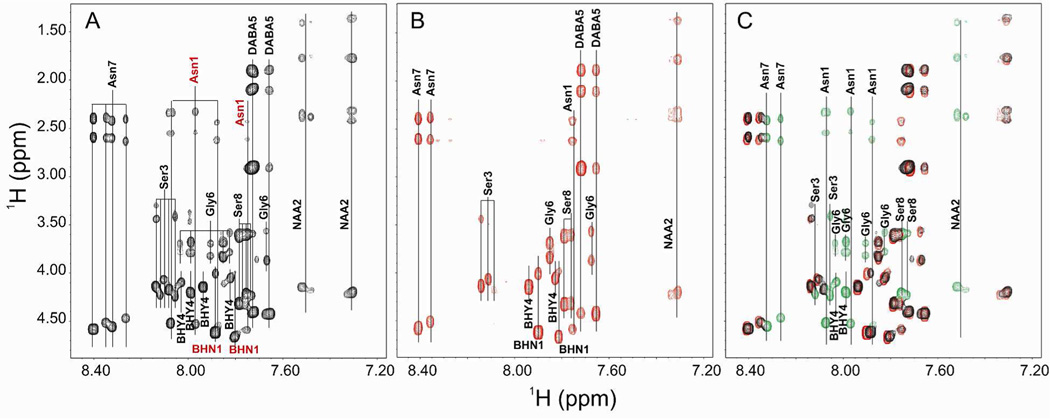
Figure 5.
TOCSY fingerprint region (NH correlations). A. NH correlations in the wild-type sample. The two BHN1 and four Asn1 spin systems present in the wild-type sample are colored red. B. NH correlations in the ocfN mutant sample. C. Overlay of the NH correlations found in the wild-type and ocfN mutant samples. NH correlations that are not present in the ocfN mutant sample are colored green.

