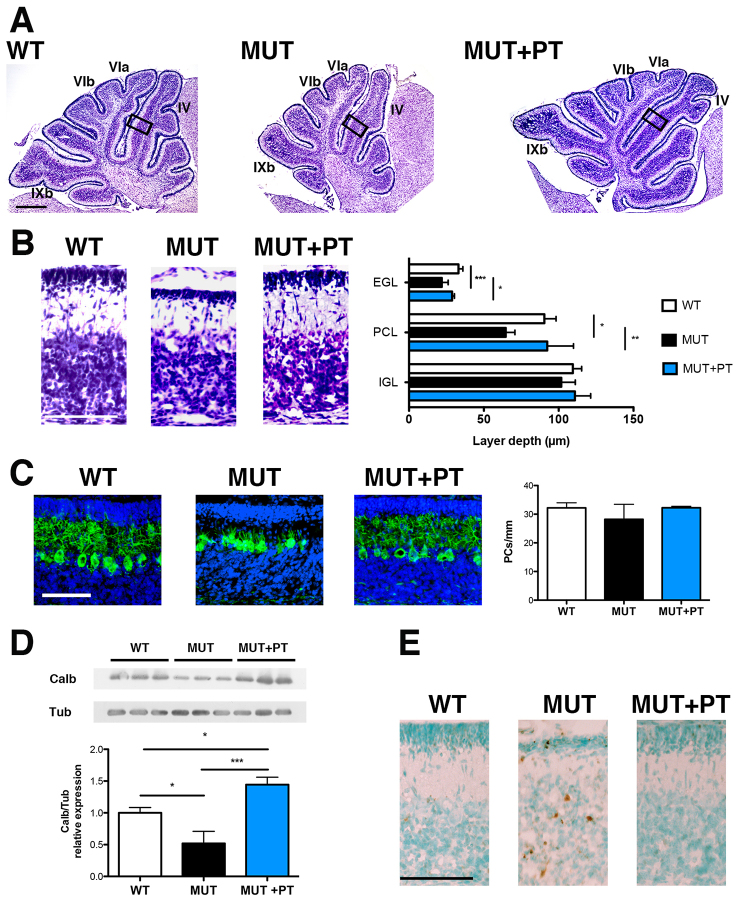
Fig. 2.
Characterization of P8 cerebellar lesions in FVB/NJ-Ugt1−/− mice with and without PT treatment. (A) Nissl staining of 8-day-old (P8) WT, untreated mutant and PT-treated mutant mice. Boxed areas indicate fields shown in panel B. IV, VIa, VIb and IXb indicate the cerebellar fissures. Scale bar: 200 μm. (B) High-magnification images of cerebellar layers from P8 mice and, in the right panel, layer depth quantification (four mice/genotype). EGL, external germinal layer; PCL, Purkinje cell layer; IGL, internal granular layer. Scale bar: 100 μm. Error bars, s.d. (C) Representative fluorescent immunohistochemistry and quantification of PC number (cells/mm) from P8 WT, untreated mutant and PT-treated mutant mice. PCs were stained with anti-calbindin1 antibody (green) and nuclei with Hoechst staining (blue). Scale bar: 50 μm. Quantification of the PC number (cells/mm) is represented in the right panel (four mice/genotype). Error bars, s.d. One-way ANOVA test not significant. (D) Western blot analysis of total cerebellum protein extract using an anti-calbindin1 antibody in P8 WT, untreated mutant and PT-treated mutant mice. Tubulin was used as a loading control. Lower panel: densitometric quantification of the bands. (E) TUNEL analysis. Positive cells are shown as brown dots; negative cells are counterstained with methyl green. Scale bar: 100 μm. One-way ANOVA test. *P≤0.05; **P≤0.01; ***P≤0.001.

