Fig. 4.
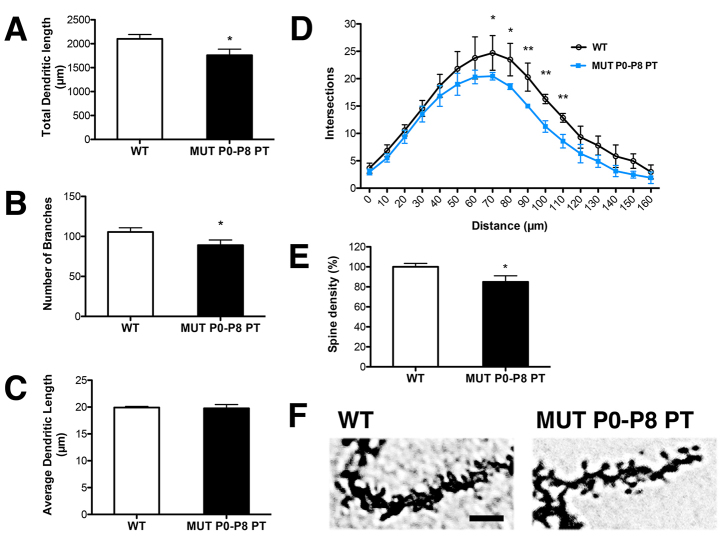
Bilirubin reduces dendrite complexity and spine density of PCs. Comparison of PCs from WT and P0–P8 PT-treated FVB/NJ-Ugt1−/− mice at P15 (four mice/genotype). (A) Total dendritic length (μm). t-test analysis. *P≤0.05. (B) Number of branches. t-test analysis. *P≤0.05. (C) Average dendritic length (μm). t-test, not significant. (D) Sholl-analysis-derived distribution of PCs and mean number of intersections of dendrite branches. t-test analysis. *P≤0.05; **P≤0.01. (E,F) Spine density (%) and representative pictures of PC spines in WT and P0–P8 PT-treated mutant mice at P15. Mann-Whitney test analysis. *P≤0.01. Scale bar: 5 μm.

