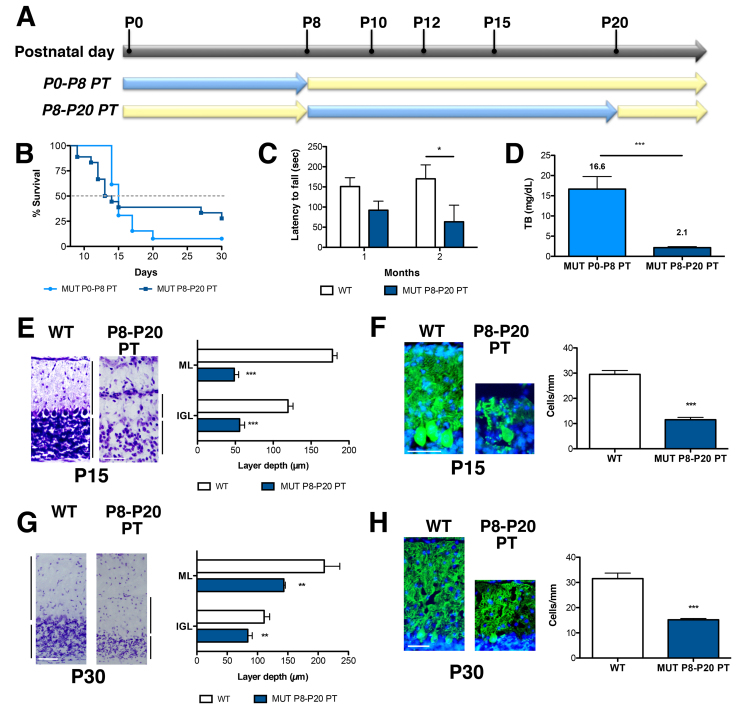
Fig. 5.
Characterization of P15 cerebellar lesions in P8–P20 PT-treated FVB/NJ-Ugt1−/− mice. (A) Schematic representation of PT (blue arrows) treatment. (B) Kaplan-Meier survival curves of FVB/NJ-Ugt1−/− mice treated with PT from P0 to P8 (light blue line with ●, n=13) and from P8 to P20 (dark blue line with ■, n=18). (C) Time course of motor coordination performance on rotarod of WT and P8–P20 PT-treated mutant mice (n=4/genotype). Two-way ANOVA test, interaction time-genotype, not significant (NS); time, NS; genotype, P≤0.01; Bonferroni’s post-hoc comparison tests: NS and P≤0.05 WT versus FVB/NJ-Ugt1−/−, at 1 and 2 months, respectively). *P≤0.01. WT, Ugt1 wild-type allele; MUT, Ugt1 mutant allele. (D) Total plasma bilirubin levels of P0–P8 and P8–P20 PT-treated mutant mice at P15 (n=14 and 4, respectively). t-test analysis. ***P≤0.0001. (E) High-magnification images of cerebellar layers from P15 mice and, in the right panel, layer depth quantification (four mice/genotype). ML, molecular layer; IGL, internal granular layer. Scale bar: 100 μm. Error bars=s.d. t-test analysis. ***P≤0.0001. (F) Representative fluorescent immunohistochemistry and quantification of PC number (cells/mm) from P15 mice. PCs were stained with anti-calbindin1 antibody (green) and nuclei with Hoechst staining (blue). Scale bar: 50 μm. Quantification of the PCs number (cells/mm) is represented in the right panel (four mice/genotype). Error bars=s.d. t-test analysis. ***P≤0.0001. (G) High-magnification images of cerebellar layers from P30 mice and, in the right panel, layer depth quantification (four mice/genotype). Scale bar: 100 μm. Error bars=s.d. t-test analysis. **P≤0.001. (H) Representative fluorescent immunohistochemistry and quantification of PC number (cells/mm) from P30 mice. PCs were stained with anti-calbindin1 antibody (green) and nuclei with Hoechst staining (blue). Scale bar: 50 μm. Quantification of the PC number (cells/mm) is represented in the right panel (four mice/genotype). Error bars=s.d. t-test analysis. ***P≤0.0001.

