Fig. 2.
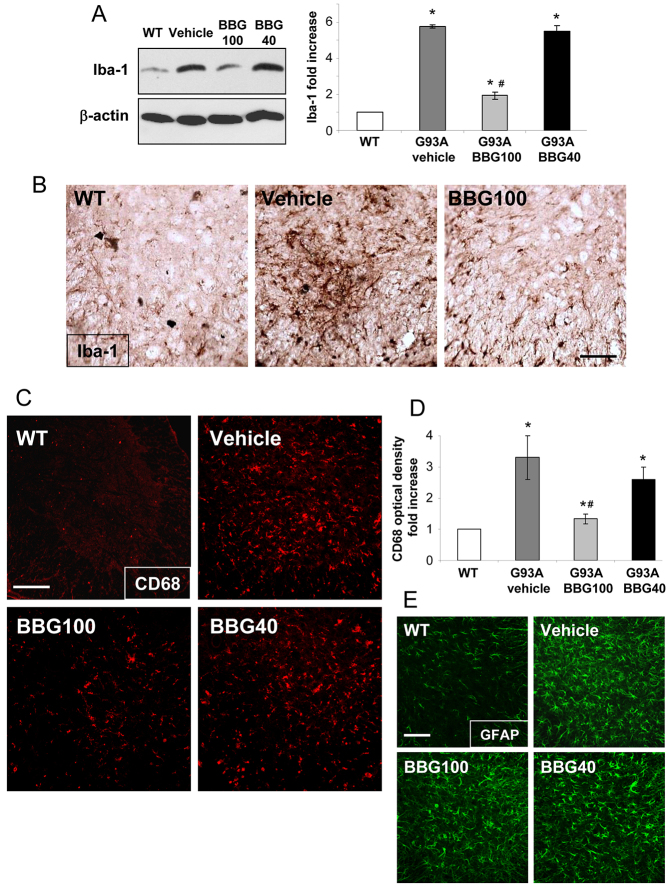
Microgliosis but not astrocytosis is decreased in BBG-treated SOD1-G93A mice. (A) Equal amounts of total lumbar spinal cord lysates from WT mice (6 months) and SOD1-G93A mice treated with vehicle or the BBG100 and BBG40 protocols at end stage (n=4) were subjected to western blotting using Iba-1 and β-actin for protein normalization. The panel on the right shows quantification of the blots relative to WT mice. (B) Spinal cord sections (L3-L5) from WT mice (6 months) and SOD1-G93A mice that had been treated with vehicle or the BBG100 protocol at end stage were stained using an antibody against Iba-1. BBG100-treated SOD1-G93A sections showed a decrease in Iba-1 labelling with respect to those from vehicle-treated SOD1-G93A mice (n=4–5 per group). (C) Spinal cord sections (L3-L5) from WT mice (6 months) and SOD1-G93A mice treated with vehicle or the BBG100 and BBG40 protocols at end stage were stained for CD68. (D) Quantitative analysis of CD68 in the ventral horns of spinal cord shows that CD68 optical density increases in vehicle-treated mice (dark grey) with respect to WT mice (white bar) and significantly decreases only upon treatment using the BBG100 protocol (grey bar), but not the BBG40 protocol (black bar), when compared with vehicle (n=4–5 per group). (E) Spinal cord sections (L3-L5) from WT mice and end-stage SOD1-G93A mice that had been treated with vehicle or the BBG100 and BBG40 protocols were stained for GFAP. Data represent means±s.e.m.; Student’s t-test compared with WT, *P<0.05; or with vehicle-treated SOD1-G93A, #P<0.05. Scale bars: 100 μm.

