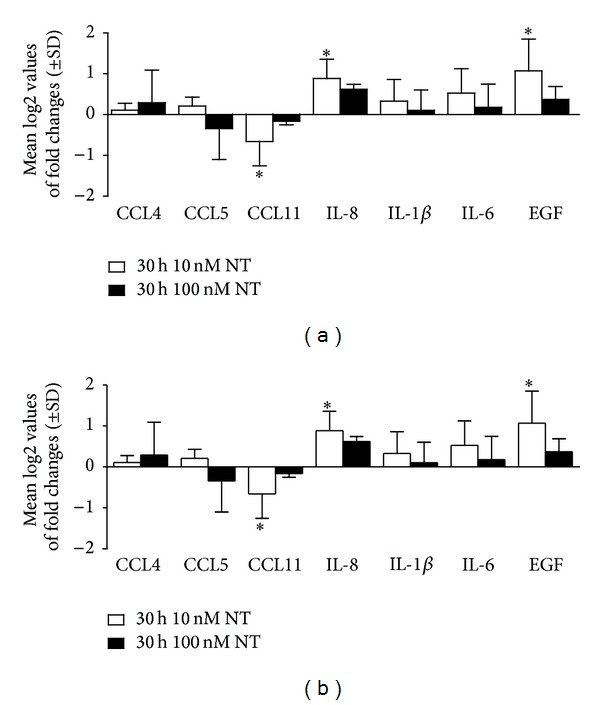
Figure 4.

Modulation of gene expression by neurotensin under homeostatic and inflammatory conditions in BJ cells. Cells were maintained in culture medium (Ctrl) and treated with 10 nM of NT (white bars) or 100 nM of NT (black bars) during 30 h (a) or pretreated with 10 nM (white bars) and 100 nM (black bars) of NT during 24 h and stimulated with 1 μg of LPS during 6 h (b), at 37°C, with 5% CO2. Total RNA was isolated and retrotranscribed as indicated in Section 2. The mRNA levels were assessed by quantitative real-time RT-PCR. Gene expression is indicated as mean log2 values of fold changes relative to the control. Each value represents the mean ± SD from four independent experiments (*P < 0.05; Kruskall-Wallis test followed by Dunn's posttest statistical analysis between 10 and 100 nM of NT, 10, and 100 nM of NT with the corresponding control, under homeostatic and inflammatory conditions).
