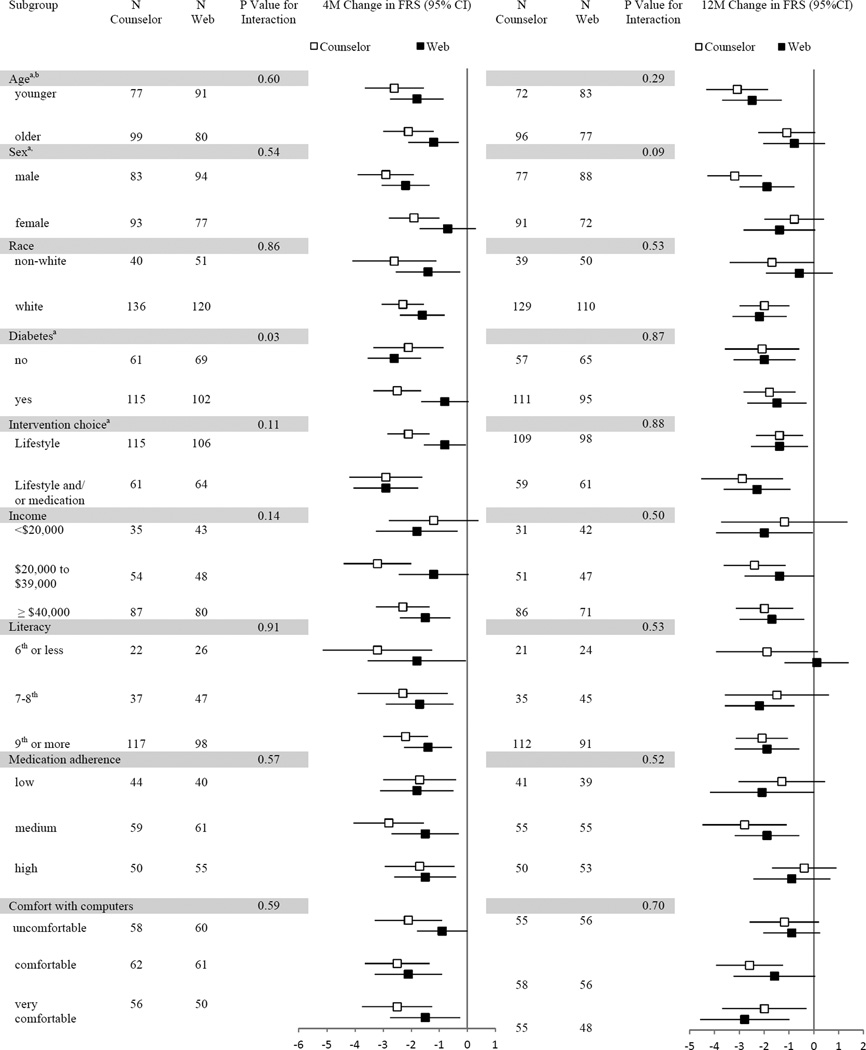
Figure 2. Change in Framingham Risk Score, stratified on selected baseline variables, shown by treatment arm at 4 and 12 month follow-up.
aAt 4 month follow-up, P-value ≤ .05 for comparison of FRS between sub-groups with web and counselor groups combined; bat 12 month follow-up, P-value ≤ .05 for same comparison.

