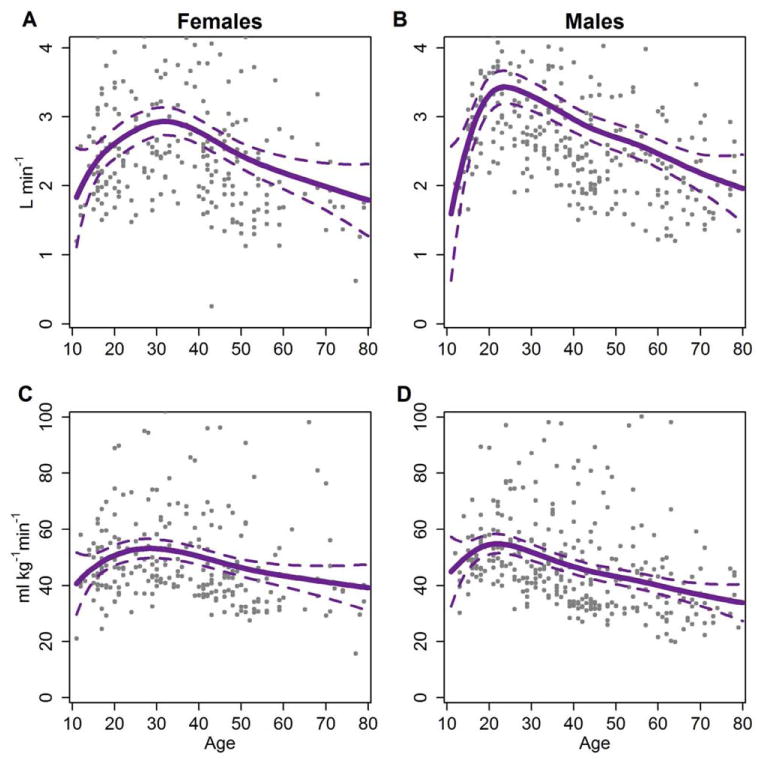
Fig. 1.

Predicted Tsimane VO2max by age. Predicted values are drawn from GAM models regressing smooths of log age on VO2max. Intervals are 95% prediction intervals. Age was smoothed using restricted maximum likelihood. Other smoothing parameters (such as Mallow's Cp and maximum likelihood) varied the age at peak absolute VO2max by up to 1 year for females and up to 2 years for males. Points represent the raw data for Tsimane. A: Absolute VO2max by age for females. B: Absolute VO2max by age for males. C: Relative VO2max by age for females. D: Relative VO2max by age for males. [Color figure can be viewed in the online issue, which is available at wileyonlinelibrary.com.]
