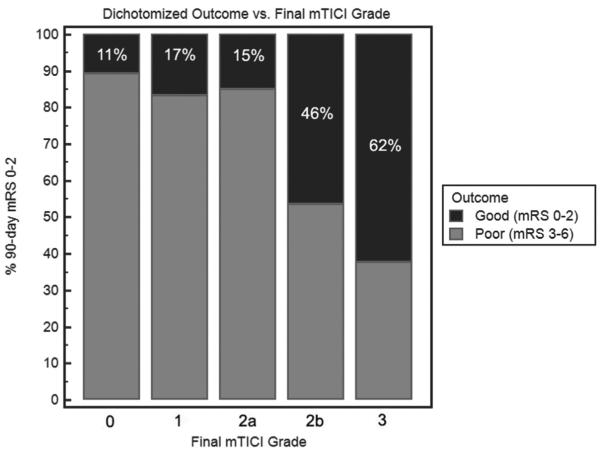
Figure 3.
Proportion of good outcomes by mTICI grade (P<0.0001 for overall comparison). In successive stepwise comparison, the only significant difference was between mTICI 2a and 2b (P<0.0001); there was a trend for the difference between mTICI 2b and 3 (P=0.09). mRS indicates modified Rankin scale; and mTICI, modified thrombolysis in cerebral infarction.

