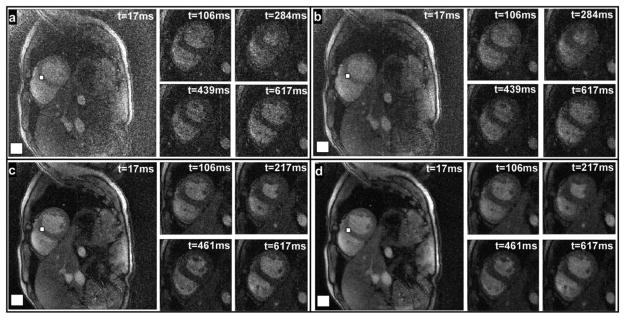
Fig. 8.

Displayed in panels (a), (c) are SENSE (R = 1.5) reconstructed short-axis cardiac images acquired at different cardiac phases, and the corresponding SSD images are shown in panels (b), (d). SNR calculations from septum and background (white boxes) show an average improvement of 40 ± 3% and 42 ± 3% (b and d, respectively).
