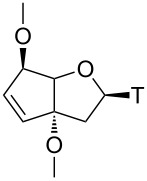
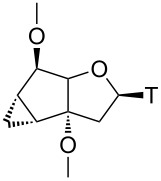
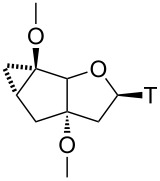
Table 2.
Sequence information and analytical data of ON1–7 as well as Tm data from UV-melting curves (260 nm) in 10 mM NaH2PO4/Na2HPO4, 150 mM NaCl, pH 7.0. Duplex concentration: 1.2 μM.
| Sequence | Modification t | Tm vs DNAa | Tm vs RNAa | |
| ON1 | d(GGATGTTCtCGA) |  |
45.3 (−2.0) | 45.6 (−2.2) |
| ON2 | d(GGAtGTTCtCGA) | 43.9 (−1.7) | 45.0 (−1.4) | |
| ON3 | d(GGATGttCTCGA) | 44.4 (−1.4) | 46.2 (−0.8) | |
| ON4 | d(GGATGTTCtCGA) |  |
44.8 (−2.5) | 43.0 (−4.8) |
| ON5 | d(GGATGTTCtCGA) |  |
45.8 (−1.6) | 46.6 (−1.2) |
| ON6 | d(GGAtGTTCtCGA) | 46.8 (−0.3) | 46.8 (−0.5) | |
| ON7 | d(GGATGttCTCGA) | 47.2 (−0.1) | 49.6 (+0.9) | |
aTm of unmodified duplex d(GGATGTTCTCGA): 47.3 °C vs DNA; 47.8 °C vs RNA; ΔTm per modification in parenthesis.
