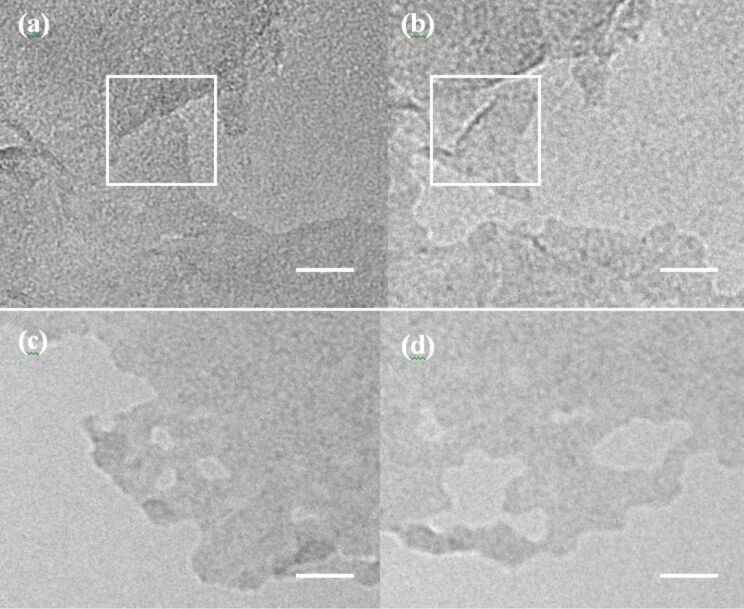
Figure 5.
Dynamics in BNNS during TEM measurement a) before and b) after beam. Time between the images is 8 s. Also visible in the sequence is the generation of vacancies within the layer. (c,d) Topological defects are incorporated during this edge reconstruction. On the other edge of the same hole, atoms are removed by the electron beam. Scale bar, 2 nm.

