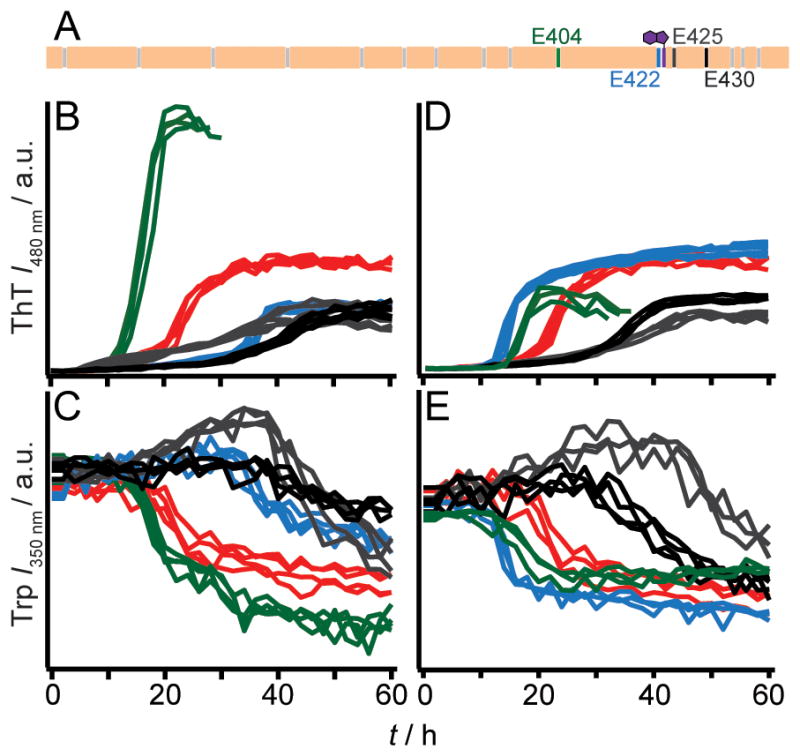
Figure 2.

Aggregation kinetics of WT RPT, single Ala- and Gln-mutants at pH 5. (A) Schematic of RPT sequence highlighting positions of residues E404 (green), E422 (blue), E425 (dark grey) and E430 (black). All other carboxylic acid sidechains and W423 are colored grey and purple, respectively. Aggregation kinetics of WT RPT (red), single Ala- (B and C), and Gln-mutants (D and E) monitored by ThT and Trp fluorescence (n = 3). Colored as noted in panel A. Intensity scales are identical for panels B/D and C/E.
