
Figure 3.
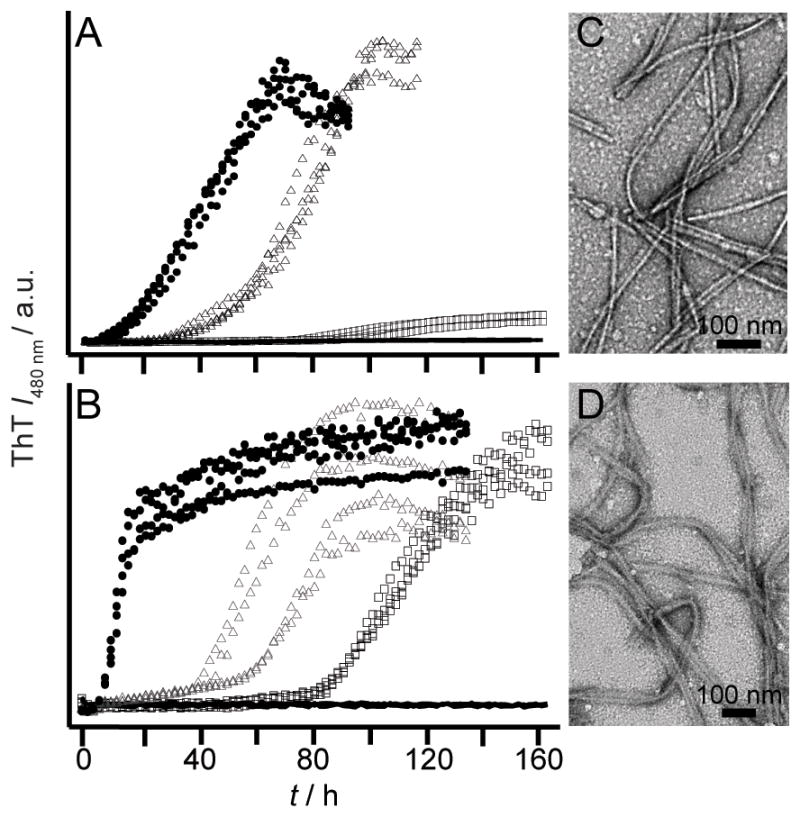
Effect of pH on aggregation kinetics of E422 mutants monitored by ThT fluorescence. E422A (A) and E422Q (B) at pH 5.5 (solid circles), 6.0 (open triangles), 6.5 (open squares), and 7 (black lines) (n ≥ 3). Intensity scales are identical. Representative TEM images for E422A (C) and E422Q (D) fibrils at pH 6.5. Scale bar is 100 nm.