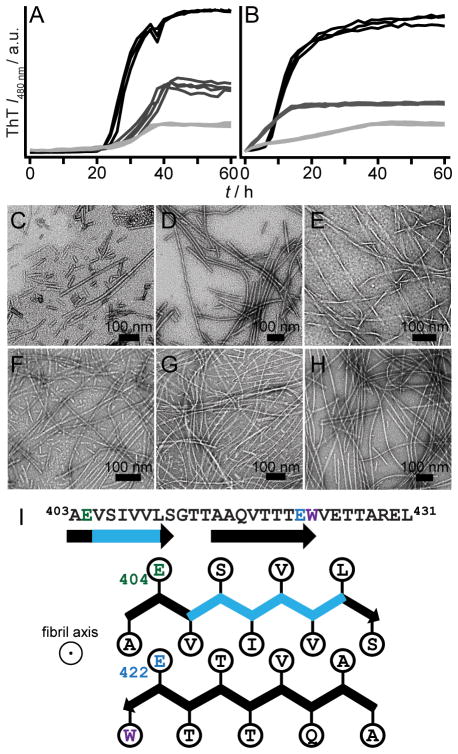
Figure 4.
Effect of pH on aggregation kinetics of E404/E422 mutants monitored by ThT fluorescence. E404A/E422A (A) and E404Q/E422Q (B) at pH 5.0 (black), 6.0 (dark grey), and 7.0 (light grey) (n = 3). Intensity scales are identical. Representative TEM images for E404A/E422A fibrils at pH 5 (C), 6 (D) and 7 (E) and E404Q/E422Q fibrils at pH 5 (F), 6 (G) and 7 (H). Scale bar is 100 nm. (I) Schematic diagram showing a possible conformation of the central core of RPT filaments, composed of two β-strands (403–411) and (415–423), depicting sidechain orientations for E404 (green) and E422 (blue) as outside and inside the β-strands, respectively. Fibril axis is coming out of the page. W423 is colored purple. Removal of the critical amyloidogenic region, VSIVVL (cyan), completely abrogates fibril formation.

