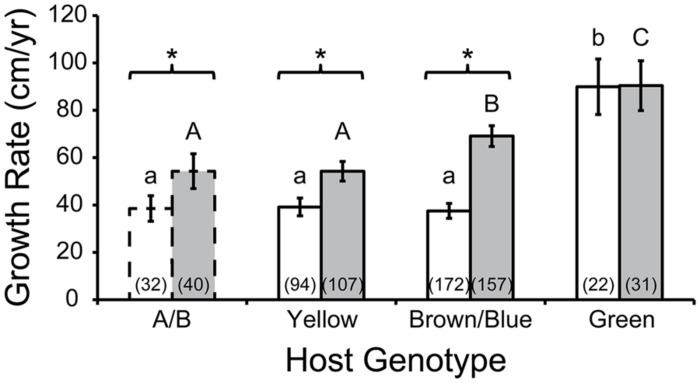
FIGURE 2.
Acropora cervicornis colony growth as a function of host genotype. The Green host genotype had higher growth rates (cm/year) then genotypes A/B, Yellow, and Brown/Blue in shallow water (white bars; similar growth rates indicated by common lower case letters, Tukey’s HSD; p < 0.05) and in deep water (gray bars, similar growth rates indicated by common upper case letters, Tukey’s HSD; p < 0.05). Growth rates were usually higher in deep compared to shallow colonies of a given genotype (asterisks: t-test; p < 0.05). Numbers in parentheses indicate sample size (number of colonies). Error bars depict 95% confidence intervals. Host A/B is bordered by dashed lines to emphasize that for this particular holobiont, the corresponding Symbiodinium “fitti” strain was distinct from the strain that was common to the other three holobionts. Data reanalyzed from Griffin et al. (2012).

