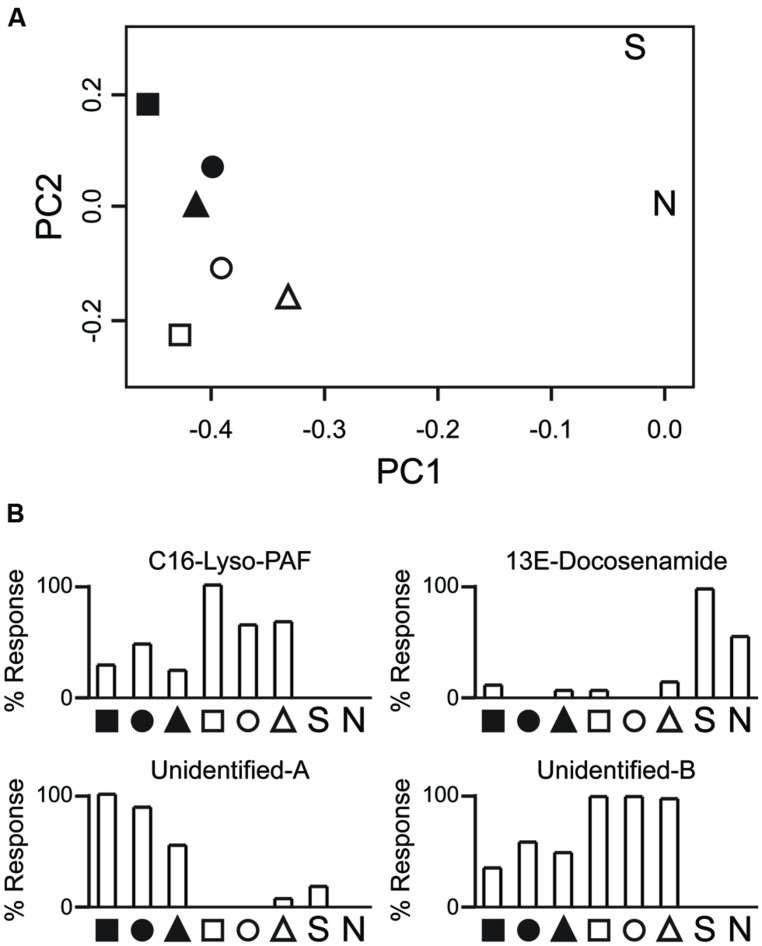
FIGURE 4.
Preliminary analysis of the Astrangia poculata–Symbiodinium psygmophilum metabolome. (A) Principle component analysis of metabolite profiles. Shown are principle components 1 and 2 (x- and y-axis, respectively) of Pareto-transformed metabolite data. Shapes indicate host genotype (n = 3). Black fills correspond to symbiont-rich polyps. White fills correspond to nearly symbiont-free polyps. “S” indicates a sample of a Symbiodinium psygmophilum monoculture. “N” indicates a negative control (purified water). Astrangia poculata samples cluster by the symbiotic state of the polyps rather than by host genotype. (B) Repre sentative profiles for specific metabolites. C16-Lyso-PAF was abundant in non-symbiotic polyps but low in symbiotic polyps and absent in Symbiodinium culture. 13E-Docosenamide was mainly present in Symbiodinium culture but not in coral tissue. The two unidentified compounds are characteristic of metabolites with greater detection in symbiotic (Unidentified-A) or non-symbiotic (Unidentified-B) polyps. Polato et al. (unpublished data).

