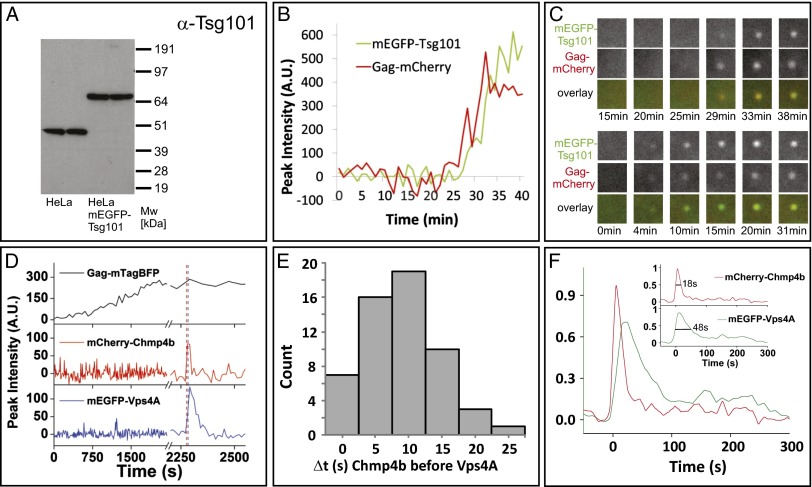
Fig. 1.
Multiple-color live-cell fluorescence microscopy of the ESCRT proteins Tsg101 or Chmp4b with Vps4A during HIV-1 Gag assembly. (A) Expression levels of Tsg101 (45 kDa) and mEGFP–Tsg101 (72 kDa) in our stable cell line. (B) Example traces for Gag and Tsg101 recruitment to assembly sites. (C) The upper three rows show the puncta in the two channels and as an overlay for the traces in B. The lower three rows are from another assembly event.1.5 × 1.5 µm2. (D) An example from imaging HeLa cells stably expressing mEGFP–Vps4A and mCherry–Chmp4b transfected with plasmids expressing Gag:Gag–mTagBFP:Vpu (5:1:2). (E) Histogram depicting the time delay in seconds of the recruitment of Vps4A and Chmp4b to sites of Gag assembly as imaged with Gag–mTagBFP (56 events from six cells). (F) Averaged dwell times, relative to initial Chmp4b recruitment, for Chmp4b and Vps4A at Gag assembly sites (56 events from six cells). (Inset) Each of the fluorescent traces for Vps4A and Chmp4b normalized to its peak signal and resampled with 0.1-s time steps. The leading edge of each trace was aligned to time 0, and the amplitude was normalized to its peak. A cumulative dwell time graph was then produced for each protein, mCherry–Chmp4b and mEGFP–Vps4A, by averaging all traces (56 from six cells) at each time interval. Vps4A dwell time is 2–3 times longer than Chmp4b. The distribution width at half maximum was 48 s for Chmp4b and 18 s for Vps4A. Vps4A was often observed to have multiple peaks, represented by the low-level signal at long time points.

