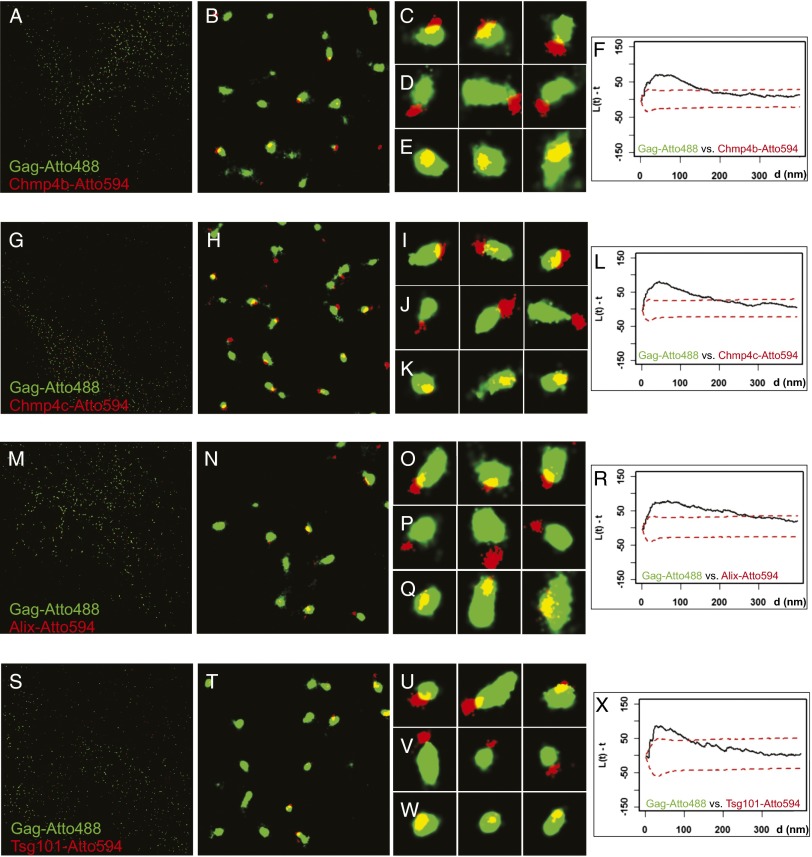
Fig. 3.
Superresolution imaging of Gag and ESCRT proteins. (A–E, G–K, M–Q, and S–W) HeLa cell line stably expressing PA-mCherry1-Chmp4b (A–E), PA–mCherry1–Chmp4c (G–K), or PA–mCherry1–Alix (M–Q) transiently transfected with Gag–PA–mGFP, Gag–iRFP, Gag and Vps4A–K173Q, or HeLa cells transiently transfected with PA–mCherry1–Tsg101, Gag–PA–mGFP, Gag–iRFP, Gag, and Vps4A–K173Q (S–W) were fixed and labeled with nanobodies targeted against GFP labeled with Atto488 (shown in green) or against RFP/mCherry labeled with Atto594 (shown in red). The mean diameters for structures of Chmp4b (115 ± 46 nm, 179 particles), Chmp4c (110 ± 41 nm, 231 particles), Alix (101 ± 50 nm, 302 particles), and Tsg101 (100 ± 41 nm, 130 particles) were smaller (P < 0.005) than the corresponding Gag structures (Chmp4b, 221 ± 117 nm; Chmp4c, 182 ± 59 nm; Alix, 198 ± 119 nm; Tsg101, 175 ± 52 nm). A, G, M, and S show the full ROI imaged and analyzed for the experiments at 40 × 40 µm2. B, H, N, and T show representative 4 × 4-µm2 areas from the large field, and C–E, I–K, O–Q, and U–W show representative 400 × 400-nm2 areas. (F, L, R, and X) Bivariate Ripley’s K Tests between assemblages labeled with Atto488 and Atto594. Gag–Atto488 assemblages clustered with Chmp4b–Atto594 (F), Chmp4c–Atto594 (L), Alix–Atto594 (R), and Tsg101–Atto594 (X).

