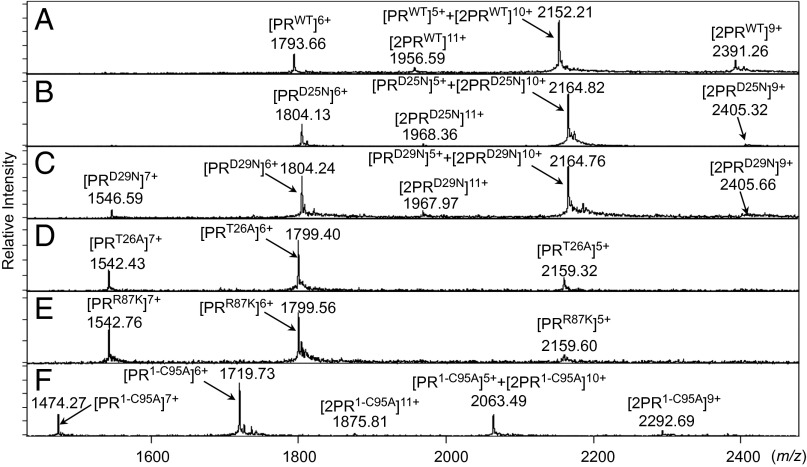
Fig. 2.
ESI-MS spectra with PRD25N, PRD29N, PRT26A, PRR87K, and PR1-C95A. (A) The ESI-MS spectrum of PRWT (10 μM). (B–F) Results of ESI-MS analysis of each mutant (10 μM). (B) The ESI-MS spectrum of PRD25N showed four peaks derived from its monomer and/or dimer ions. (C) PRD29N showed five peaks including +11 or +9 charged dimer ions. (D and E) The ESI-MS spectra of PRT26A and PRR87K, respectively. The isotopologue ion peak analysis showed that all peaks detected in the ESI-MS spectra of PRT26A and PRR87K were derived from monomer ions (Fig. S4 and Table S1). (F) In the spectrum of PR1-C95A, five peaks including the +11 and +9 charged dimer ions were seen. The average mass of PRWT, PRD25N, PRD29N, PRT26A, PRR87K, and PR1-C95A are 10,755.76, 10,818.86, 10,818.86, 10,789.82, 10,791.83, and 10,312.24, respectively.

