
Fig. 3.
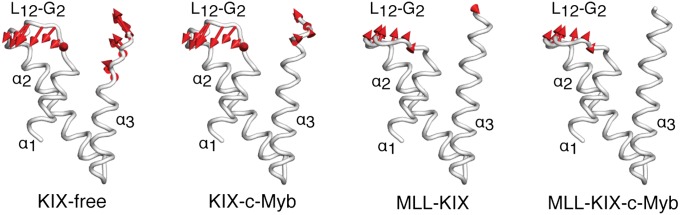
Root-mean-square fluctuations from PCA. The average KIX structure from each simulation is shown in white, and the ligands were omitted for clarity. The red arrows point along the direction of the lowest frequency mode (highest ranked eigenvector), and the amplitude is directly proportional to the length of the arrow. Only fluctuations greater than 1.0 Å are displayed.