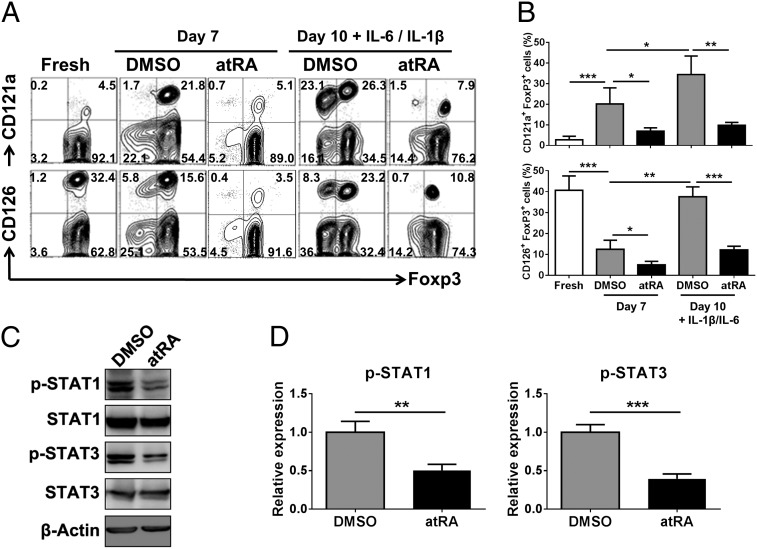
Fig. 3.
atRA decreases IL-1R and IL-6R expression and down-stream signal molecules on nTregs when stimulated with IL-1β and IL-6. nTregs were sorted and expanded as described earlier. The IL-1R (CD121a) and IL-6R (CD126) expression on freshly isolated or expanded nTregs pretreated with atRA or DMSO before (day 7) and after (day 10) IL-1β/IL-6 stimulation was examined. (A) Data are representative of three separate experiments (gated on Foxp3+ cells). (B) Values are mean ± SEM of three independent experiments. (C) The expanded nTregs primed with atRA or DMSO were stimulated with IL-1β and IL-6 for 30 min, and the levels of phosphorylated STAT1 and STAT3 were determined by Western blot. Data are representative of four separate experiments with the similar results. (D) The histograms show the relative phosphorylation level (mean ± SEM of four separate experiments) of STAT1 and STAT3 at Tyr705 or Tyr701 normalized to the expression of the total STAT1 and STAT3 protein. The DMSO vehicle has been arbitrarily assigned as 1 with the others represented to this value (**P < 0.01 and ***P < 0.001).

