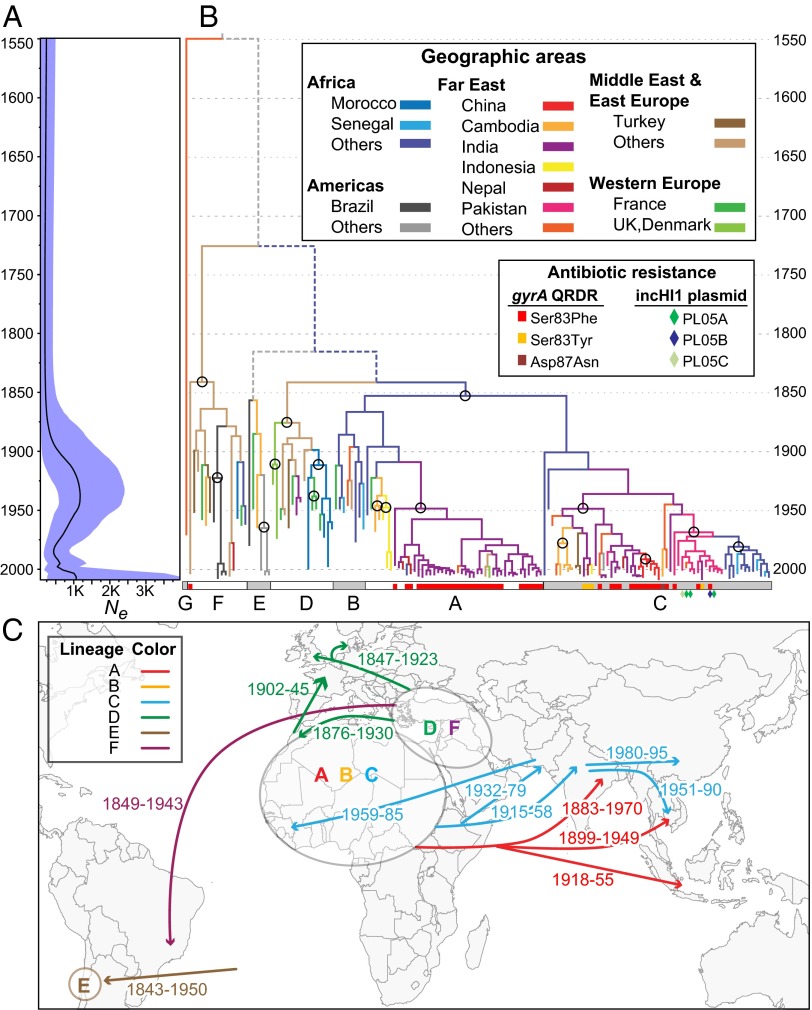
Fig. 1.
Phylogeny and demography of Paratyphi A. The 4,525 nonrepetitive, nonrecombinant SNPs in the core genome (Table 1) were analyzed with Beast 1.8 by using the model (exponential clock rate; Bayesian Skyline) of population dynamics among 14 combinations (Dataset S1, tab 2), which yielded the highest Bayes factors. (A) Bayesian skyline plot showing temporal changes since 1549 in effective population size (Ne) (black curve) with 95% confidence intervals (cyan). (B) Maximum clade credibility tree (asymmetric diffusion model, BSSVS, no transmission from Western Europe), colored by geographical sources of bacterial isolates (tips) and inferred historical sources (branches). Older transmissions that were supported by ≥80% of trees are indicated by circles, and depicted in C. Inner branches with lower levels of support are indicated by dashed, colored (≥50% support), or gray (<50%) lines. Lineages A..G are indicated at the base by alternating white and gray rectangles, which also present information on antibiotic resistance due to mutations in gyrA or the acquisition of an MDR IncHI1 plasmid (diamonds). (C) Sources (ovals) of lineages and associated geographic transmissions (arrows with CI95% of dates; Dataset S1, tab 3).

