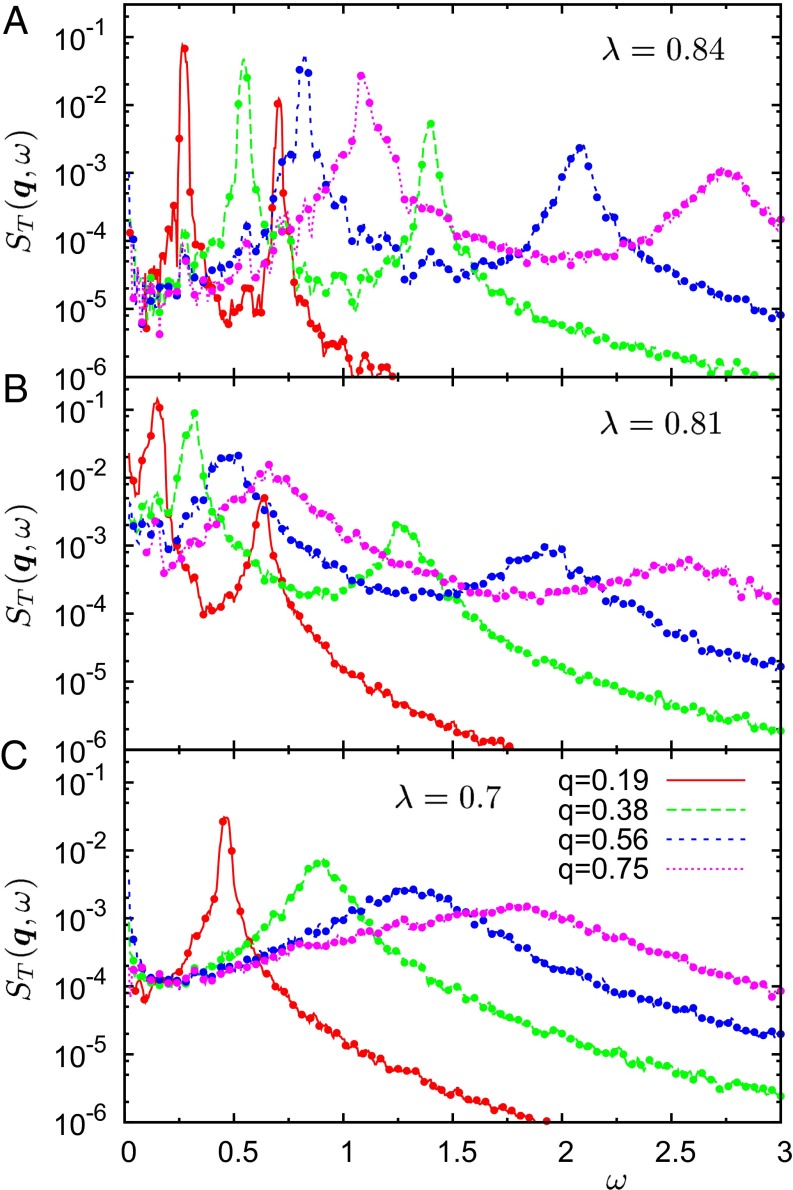
Fig. 2.
Transverse dynamic structure factors, , at the indicated values of the wave vector in the (110) direction, calculated from Eq. 1. Three values of λ are shown, in a defective crystal state (A), at the amorphisation transition (B), and in the fully developed glassy phase (C). Two Brillouin peaks, corresponding to the T1 and T2 branches, are visible for λ = 0.84 and 0.81. In the glassy phase (λ = 0.7) only one degenerate excitation survives.

