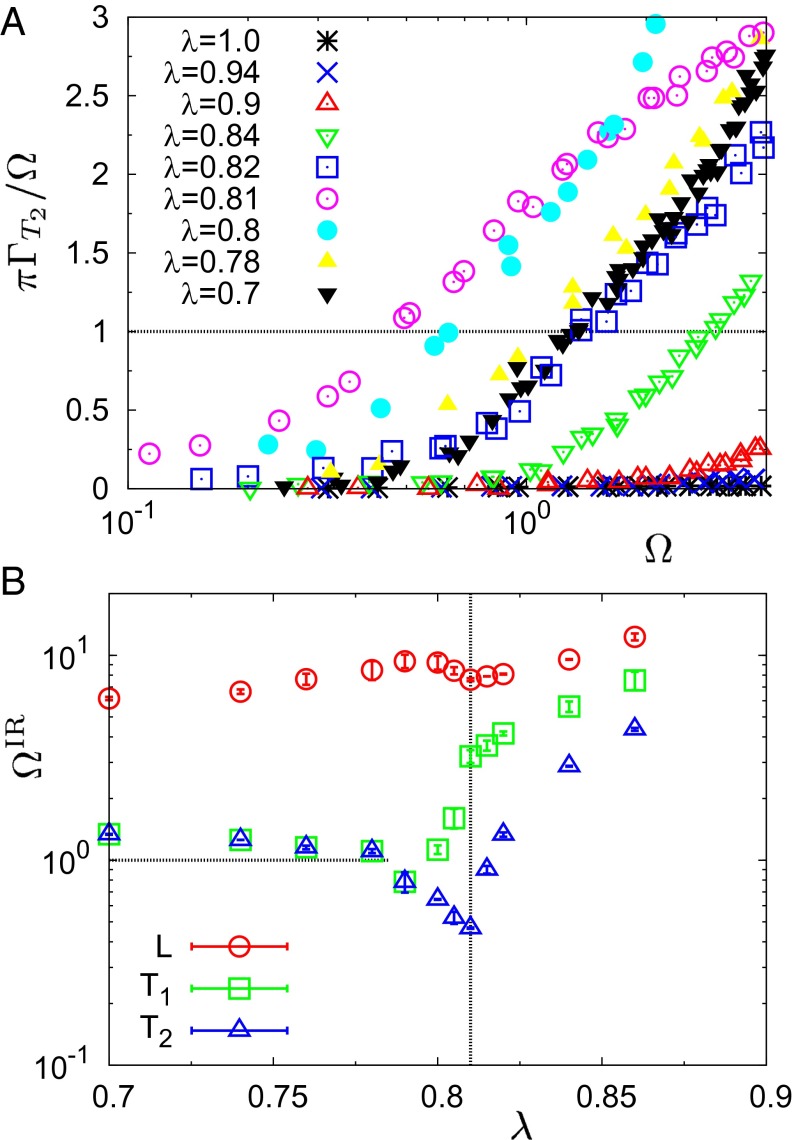
Fig. 4.
Characterization of the IR limit. (A) Ratio for the T2 excitations, calculated from the data of Fig. 3, at the indicated values of λ. The frequency corresponding to the intersection of each dataset with the horizontal line at the value 1 defines the IR limit, . (B) λ dependence of extracted from the above data, corresponding to the T2 branch. We also show and for the longitudinal (L) and higher transverse (T1) branches, respectively. The vertical line indicates the transition point λ* ≃ 0.81. The horizontal line corresponds to the BP position, ΩBP ≃ 1, for the amorphous phases at λ ≤ 0.78.

