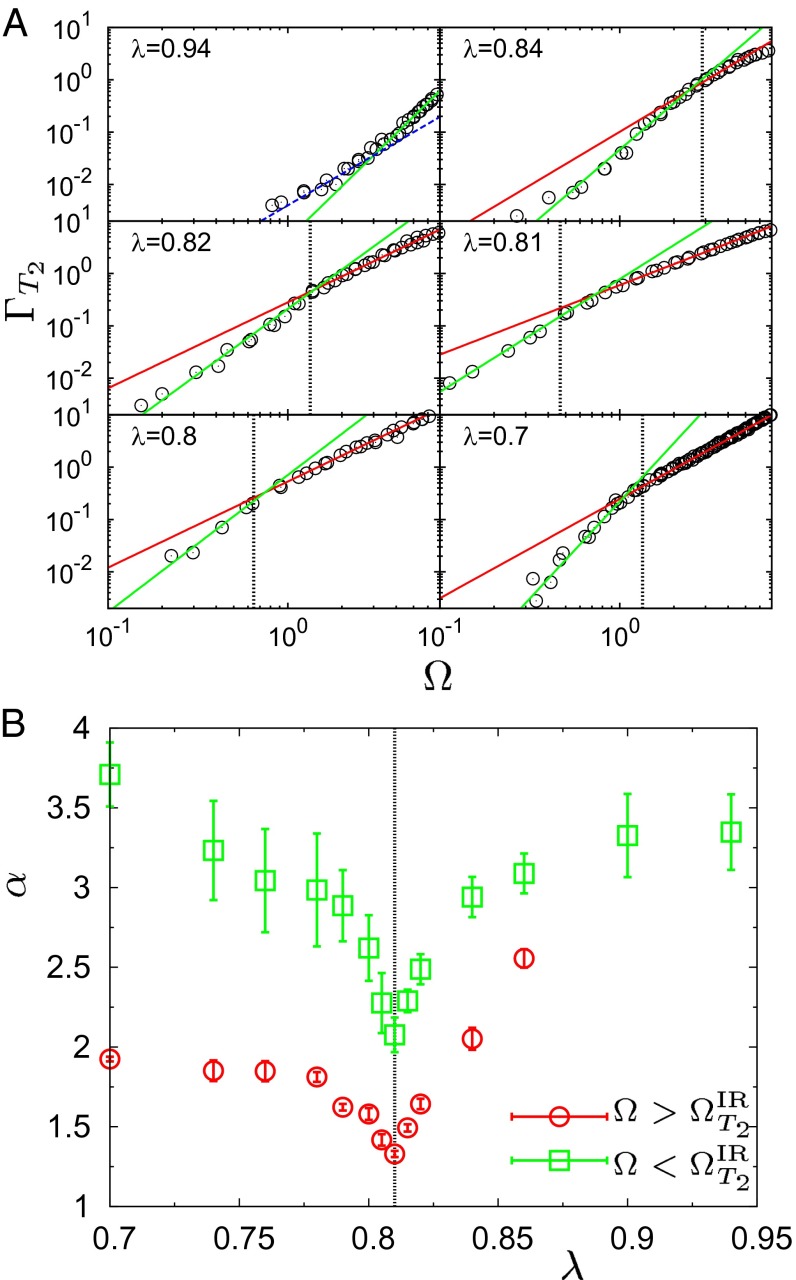
Fig. 5.
Frequency dependence of broadening for the T2 excitations at the investigated values of λ . (A) Ω dependence of the broadening at the indicated values of λ. Red and green solid lines are the best power-law fits of the form ≃Ωα to the data in the high and intermediate frequency ranges, respectively. is indicated by the vertical dashed lines in all cases except λ = 0.94, where is comparable to the highest frequency comprised in the vDOS. For λ = 0.94, the low-frequency cross-over to the anharmonic ≃Ω2 behavior is indicated by the blue dashed line. (B) Values of the exponents α extracted from the best fit to the data in A for the high (circles) and intermediate (squares) frequency ranges, respectively. A detailed discussion of these data is included in the text.

