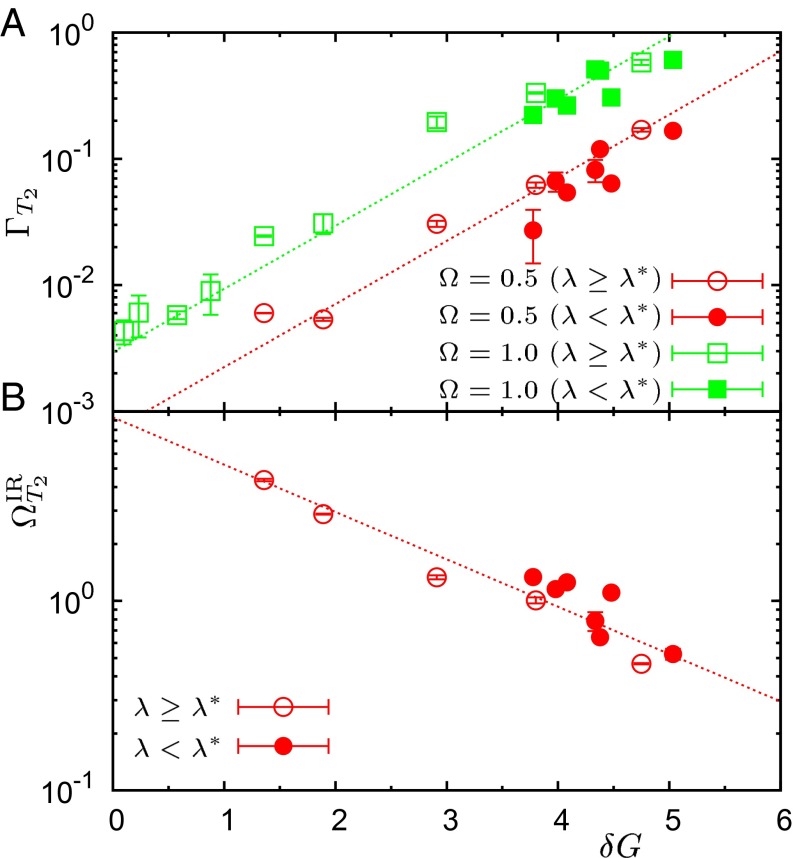
Fig. 7.
Direct correlation of features of acoustic-like excitations with local elastic heterogeneities. Here we show the dependence on the extent of the elastic heterogeneities of (A) broadening, , and (B) IR frequency, , for the T2 acoustic excitations. Data are plotted versus the SD δG of the distribution of the relevant local elastic modulus, calculated for a coarse-graining length scale w = 3.16 (see Fig. 1B). δG ≃ δGp for λ ≥ λ* (open symbols) and δG ≃ δGp + δGs for λ < λ* in the amorphous phases (closed symbols). A discussion of this point is included in the text. In A we plot values of corresponding to two different fixed frequencies, Ω ≃ 0.5 and Ω ≃ 1. Dashed lines are guides for the eye.

