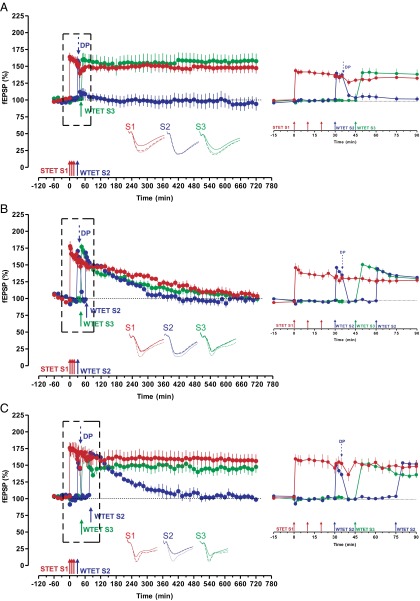
Fig. 2.
Determinants of synaptic competition. (A) Induction of L-LTP by STET at 0 min in S1 (red filled circles) followed by E-LTP by WTET in S2 at 30 min (blue filled circles). Five minutes after E-LTP in S2, low-frequency stimulation (1 Hz, 250 pulses) was applied for inducing depotentiation. Another E-LTP was induced in S3 at 45 min (green filled circles). Here, synaptic tagging between S1 and S3 was intact (n = 7). (B) The experimental design was the same as in A but the depotentiated E-LTP (filled blue circles) was again reactivated with a WTET at 60 min (n = 7). (C) The experimental design was the same as in B but the depotentiated E-LTP (filled blue circles) was reactivated at 75 min (n = 7). For clarity, relevant stimulations at a specific time period are highlighted (Left). Symbols and traces are as in Fig. 1.

